
GIS Software
Building, editing, and analyzing geodata across the leading desktop and online GIS stacks.

Hi, I'm Farmana Ditya, a fresh graduate in Applied GIS from Universitas Gadjah Mada. I build spatial analyses, cartographic visualizations, and web maps that turn raw geodata into institutional-grade insight.
I focus on spatial analysis, cartography, and web mapping, turning satellite imagery, field surveys, and tabular records into clear, decision-grade products. I value precision, reproducibility, and clean visual hierarchy.
Three pillars define how I work: industry-standard GIS software, programming for automation, and remote sensing for global-scale observation.
Building, editing, and analyzing geodata across the leading desktop and online GIS stacks.
Automating geoprocessing, building web maps, and shipping interactive geospatial dashboards.
Extracting land cover, environmental change, and vulnerability signals from satellite imagery.
From StoryMaps to remote-sensing apps, Python-driven data science, and web platforms, a sample of where I've shipped end-to-end.

Project manager for the official website of the Luwes 59th anniversary 5K fun run. Led client liaison and payment gateway onboarding for a React, Vite, Node.js, Express, and PostgreSQL event site with online registration.
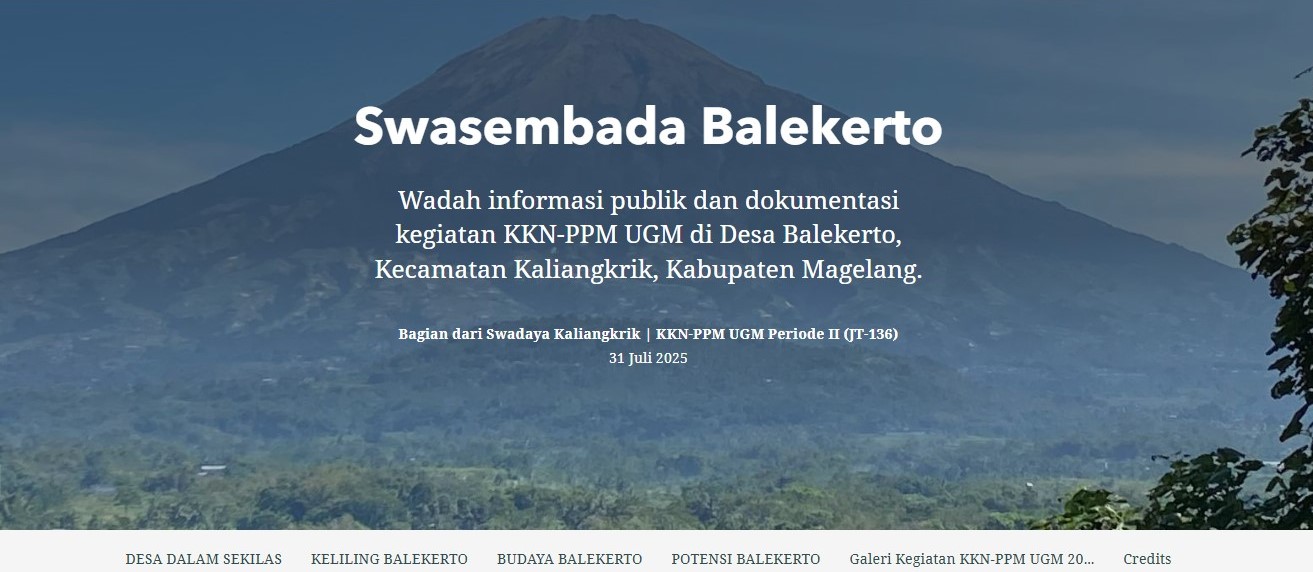
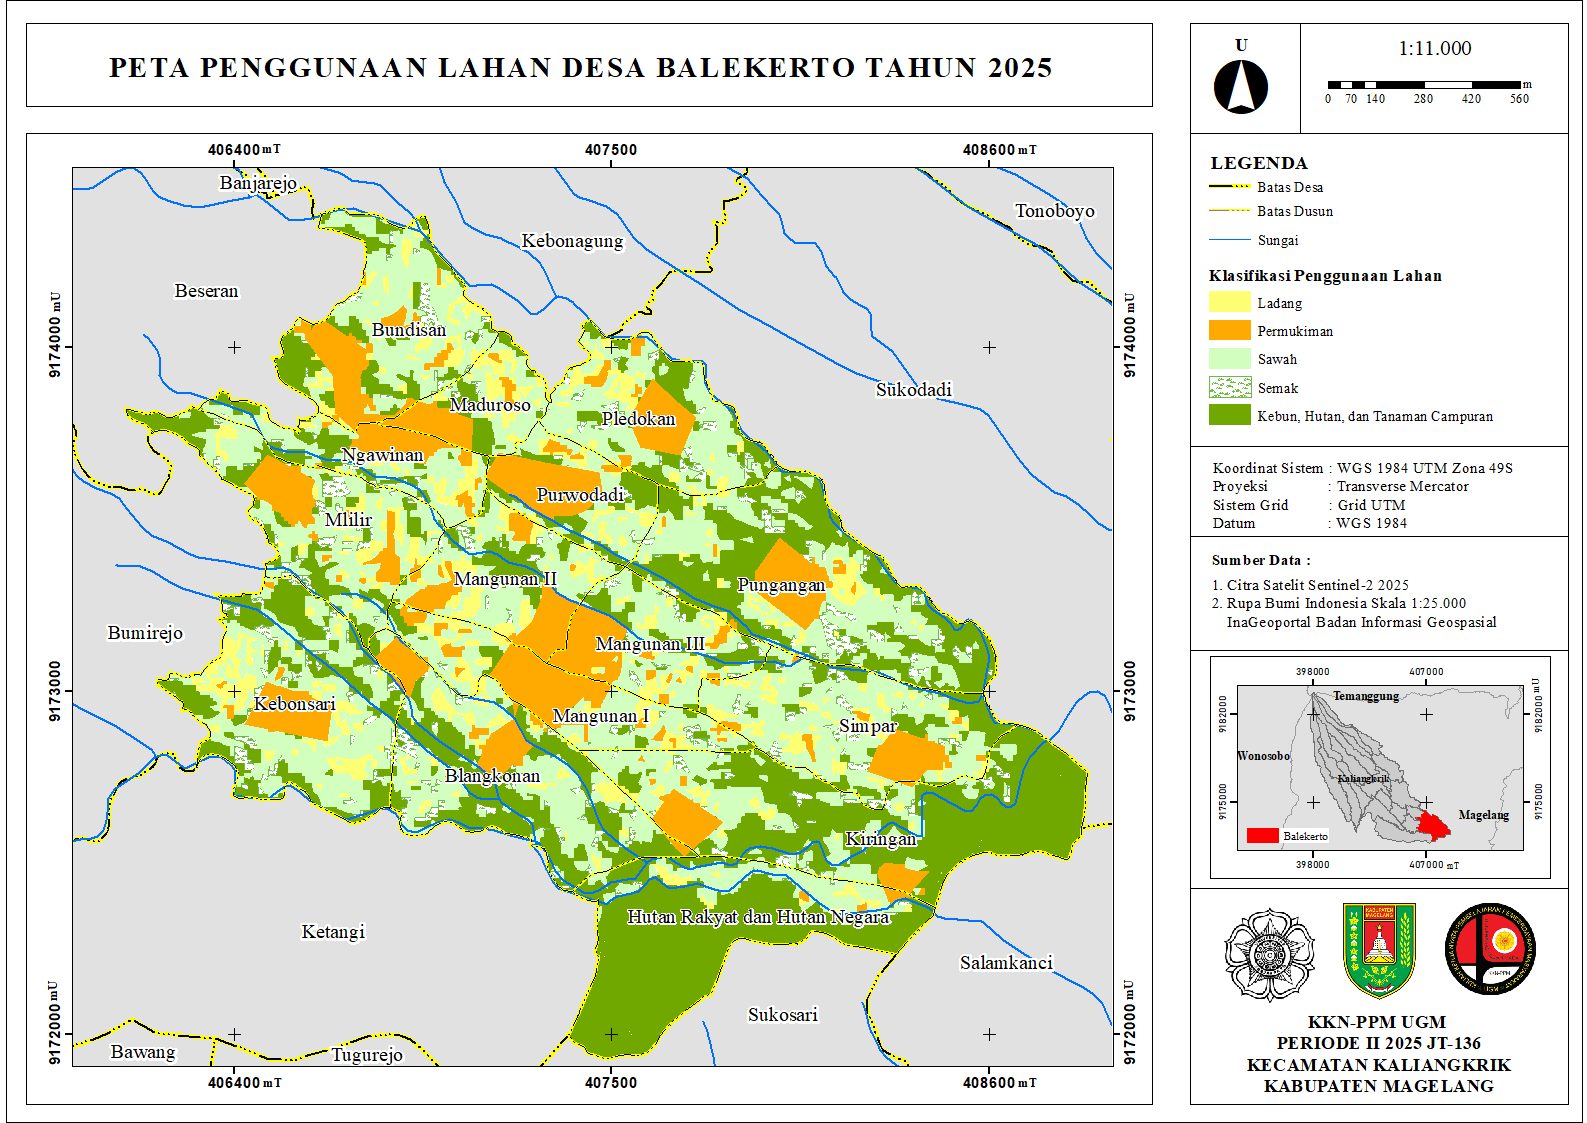
Public information and documentation of KKN-PPM UGM activities in Balekerto Village: geography, culture, and community potential.
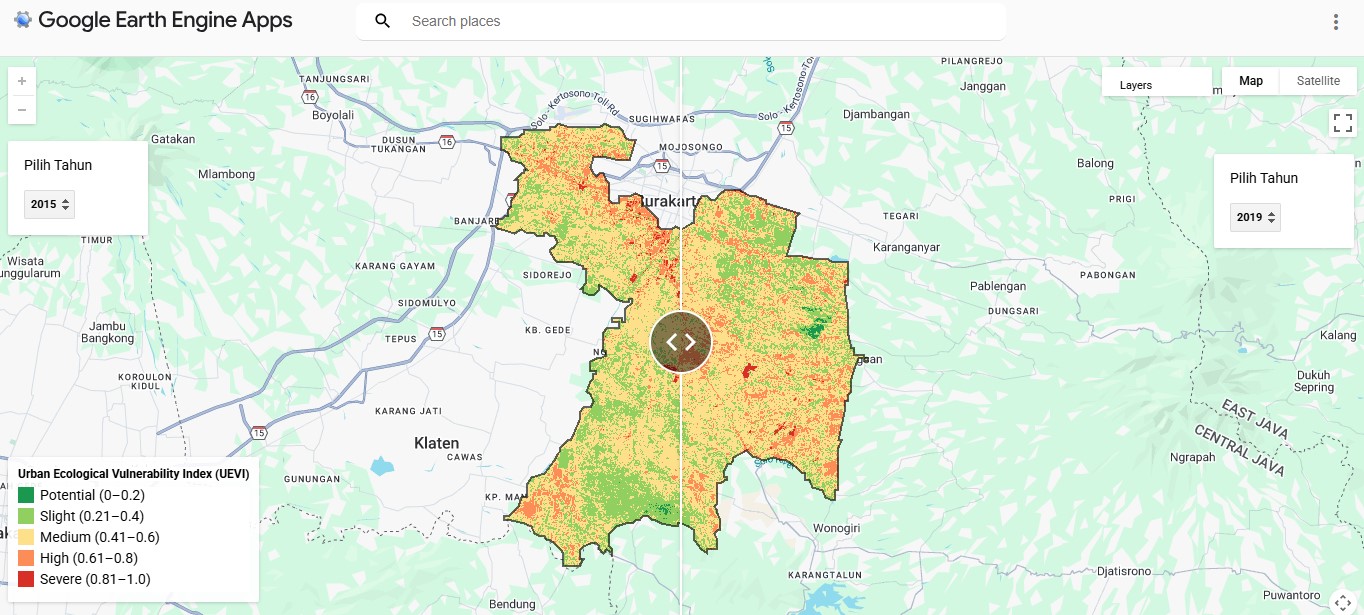
Interactive Google Earth Engine app visualizing Urban Ecological Vulnerability Index (UEVI) in Sukoharjo via a year-by-year swipe interface.
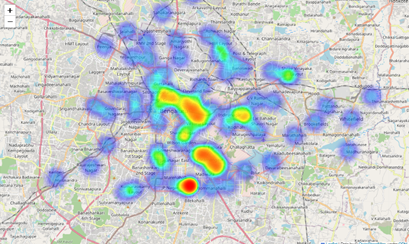
Geospatial data science project analyzing restaurant distribution and service coverage in Bangalore using Python, spatial analysis, and visualization.
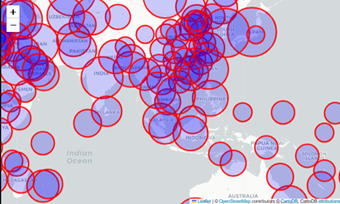
Global COVID-19 case analysis combining statistical comparisons and geospatial mapping to identify patterns, hotspots, and regional impacts.
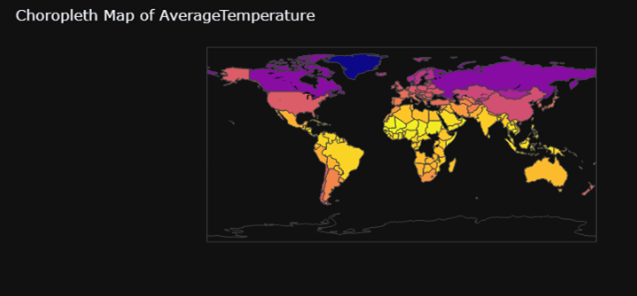
Analysis of global temperature trends with Python, interactive mapping, and statistical analysis to uncover patterns of climate change.
Interactive dashboard visualizing CO₂ emissions per capita using Tableau Public. Explore global and regional patterns with dynamic charts and maps.
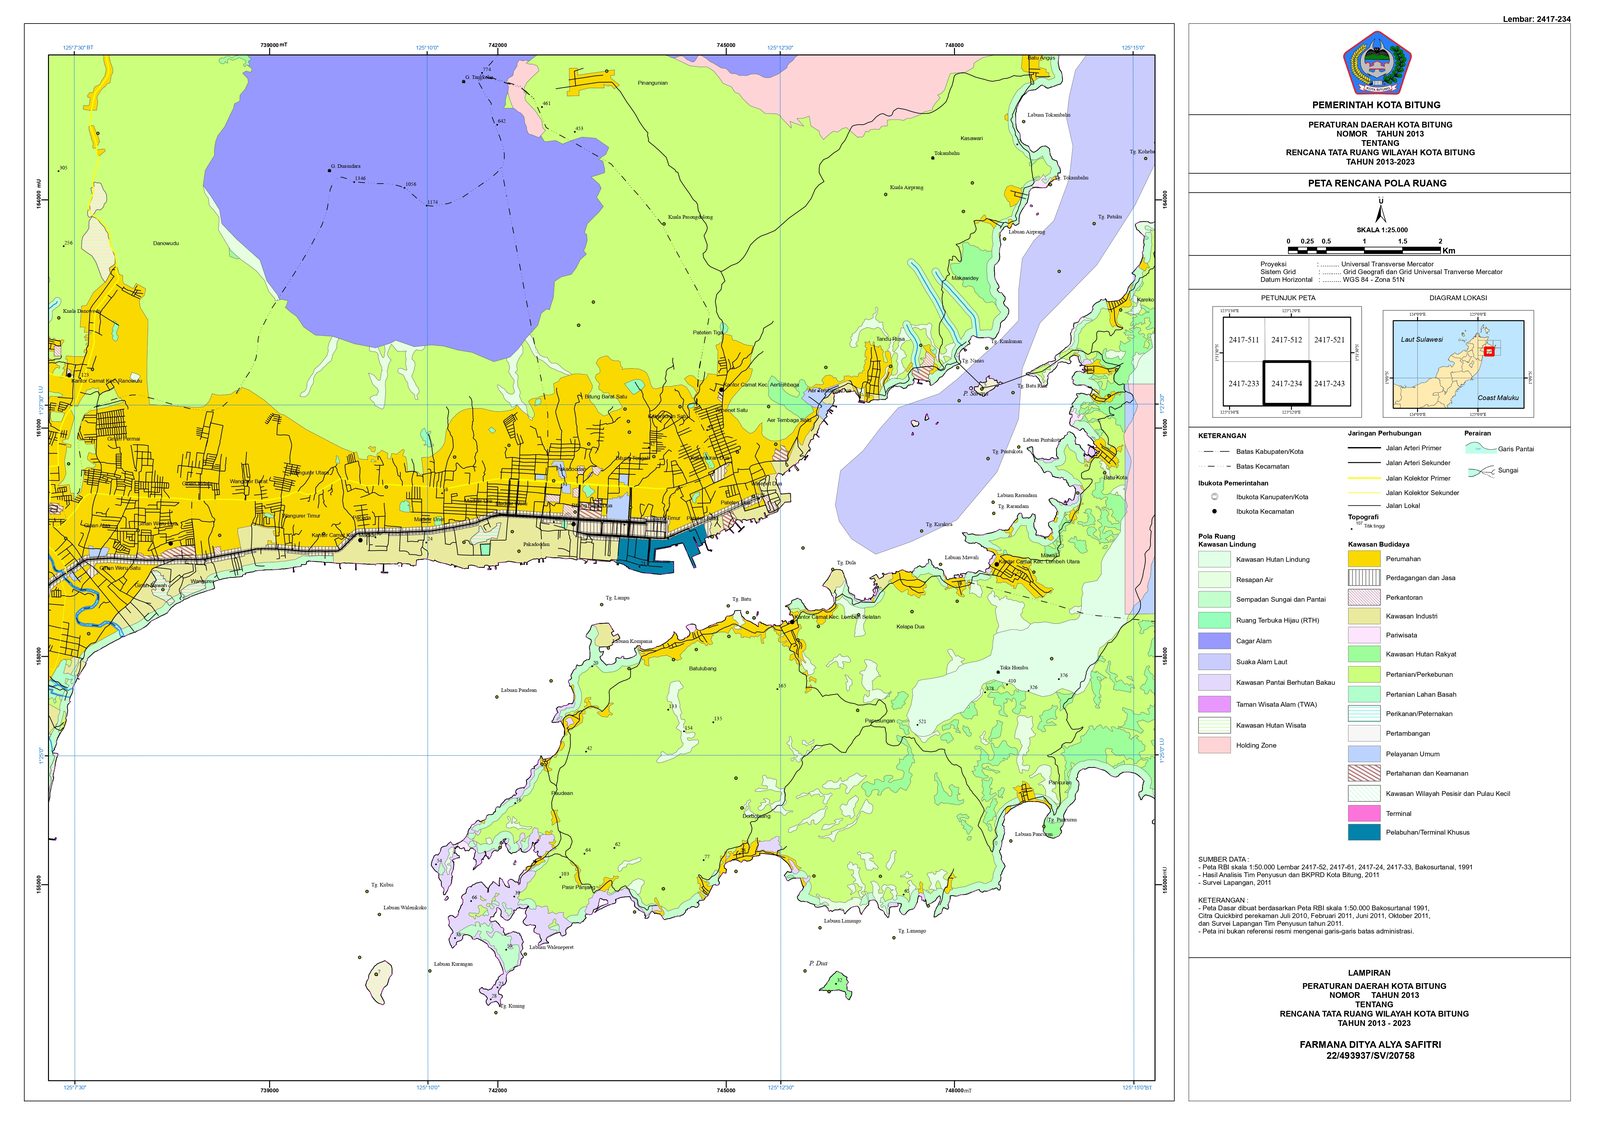
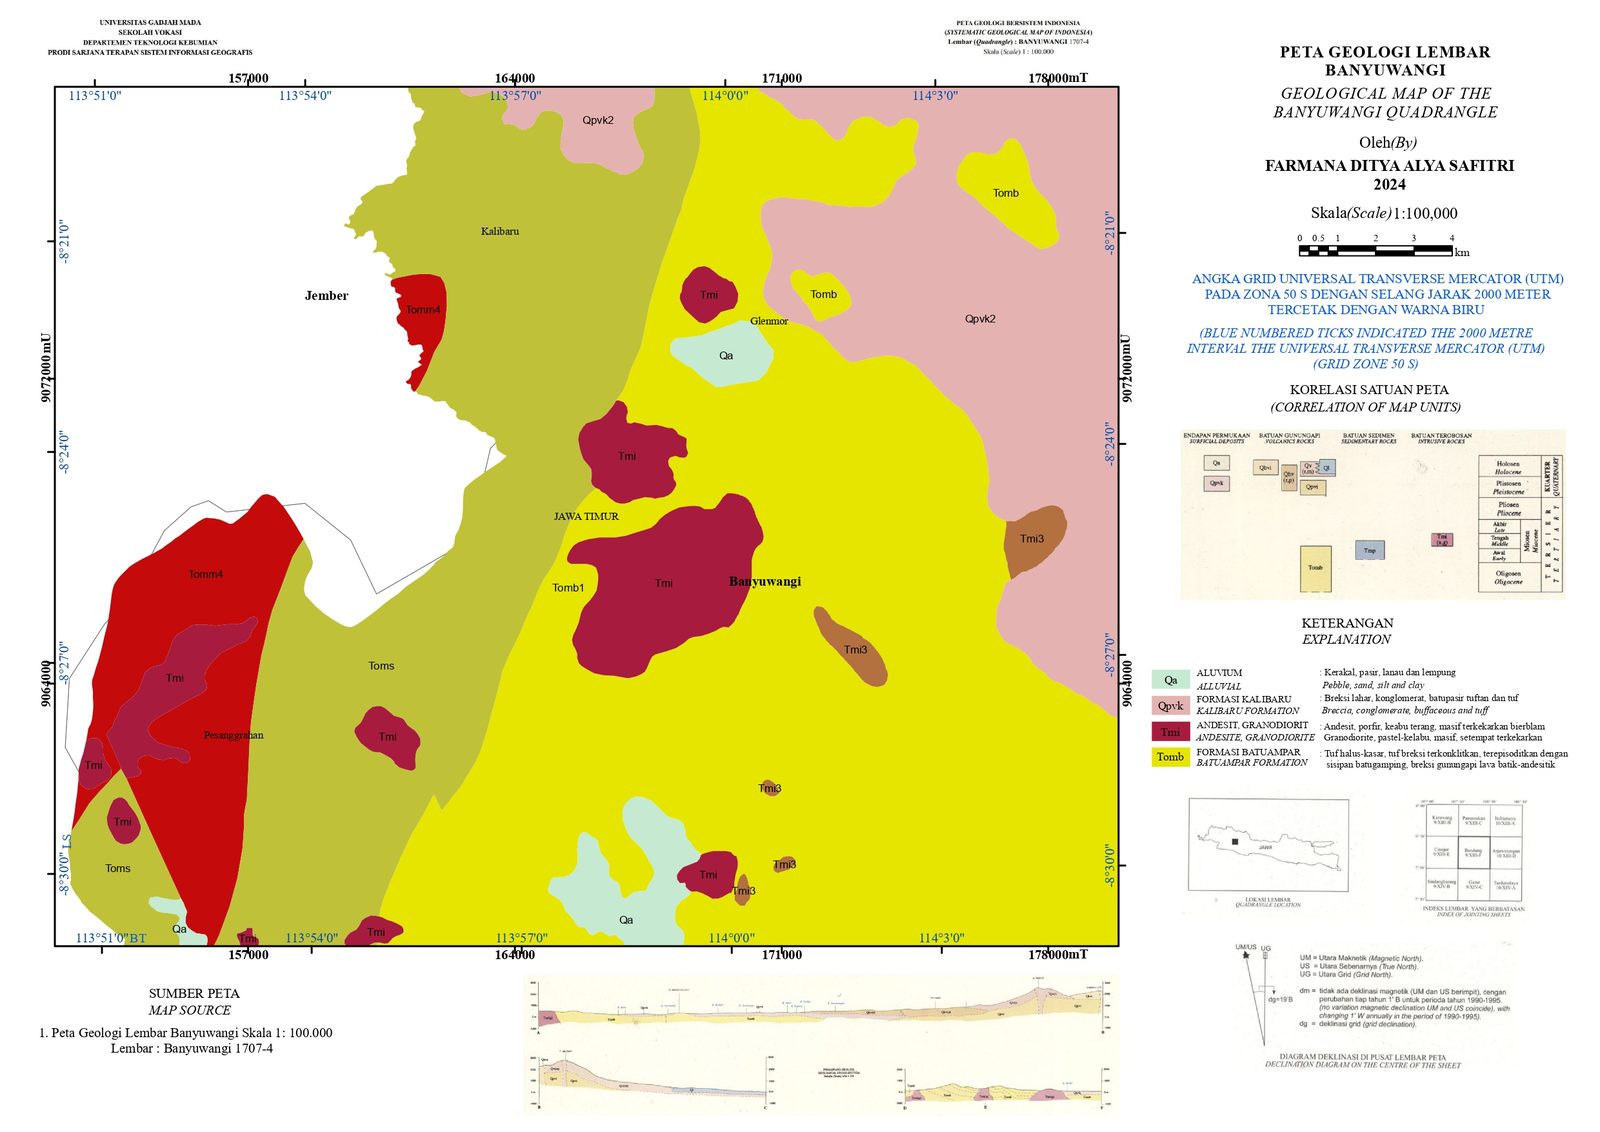
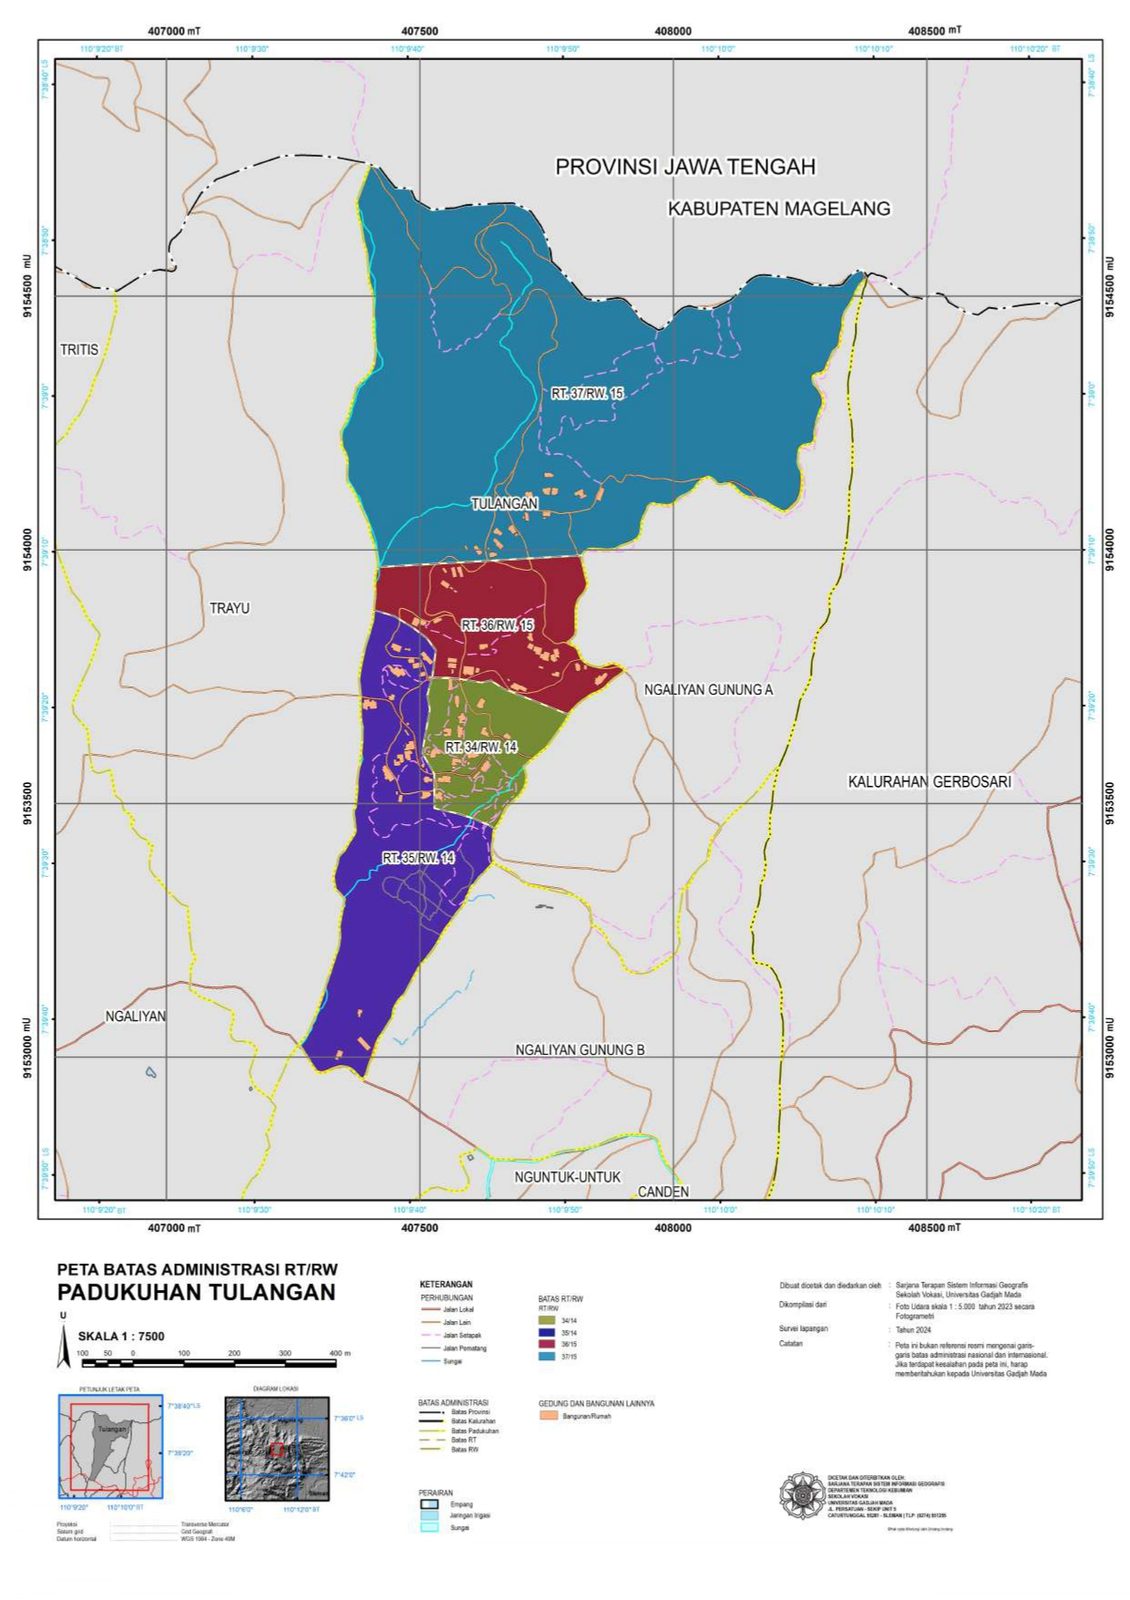
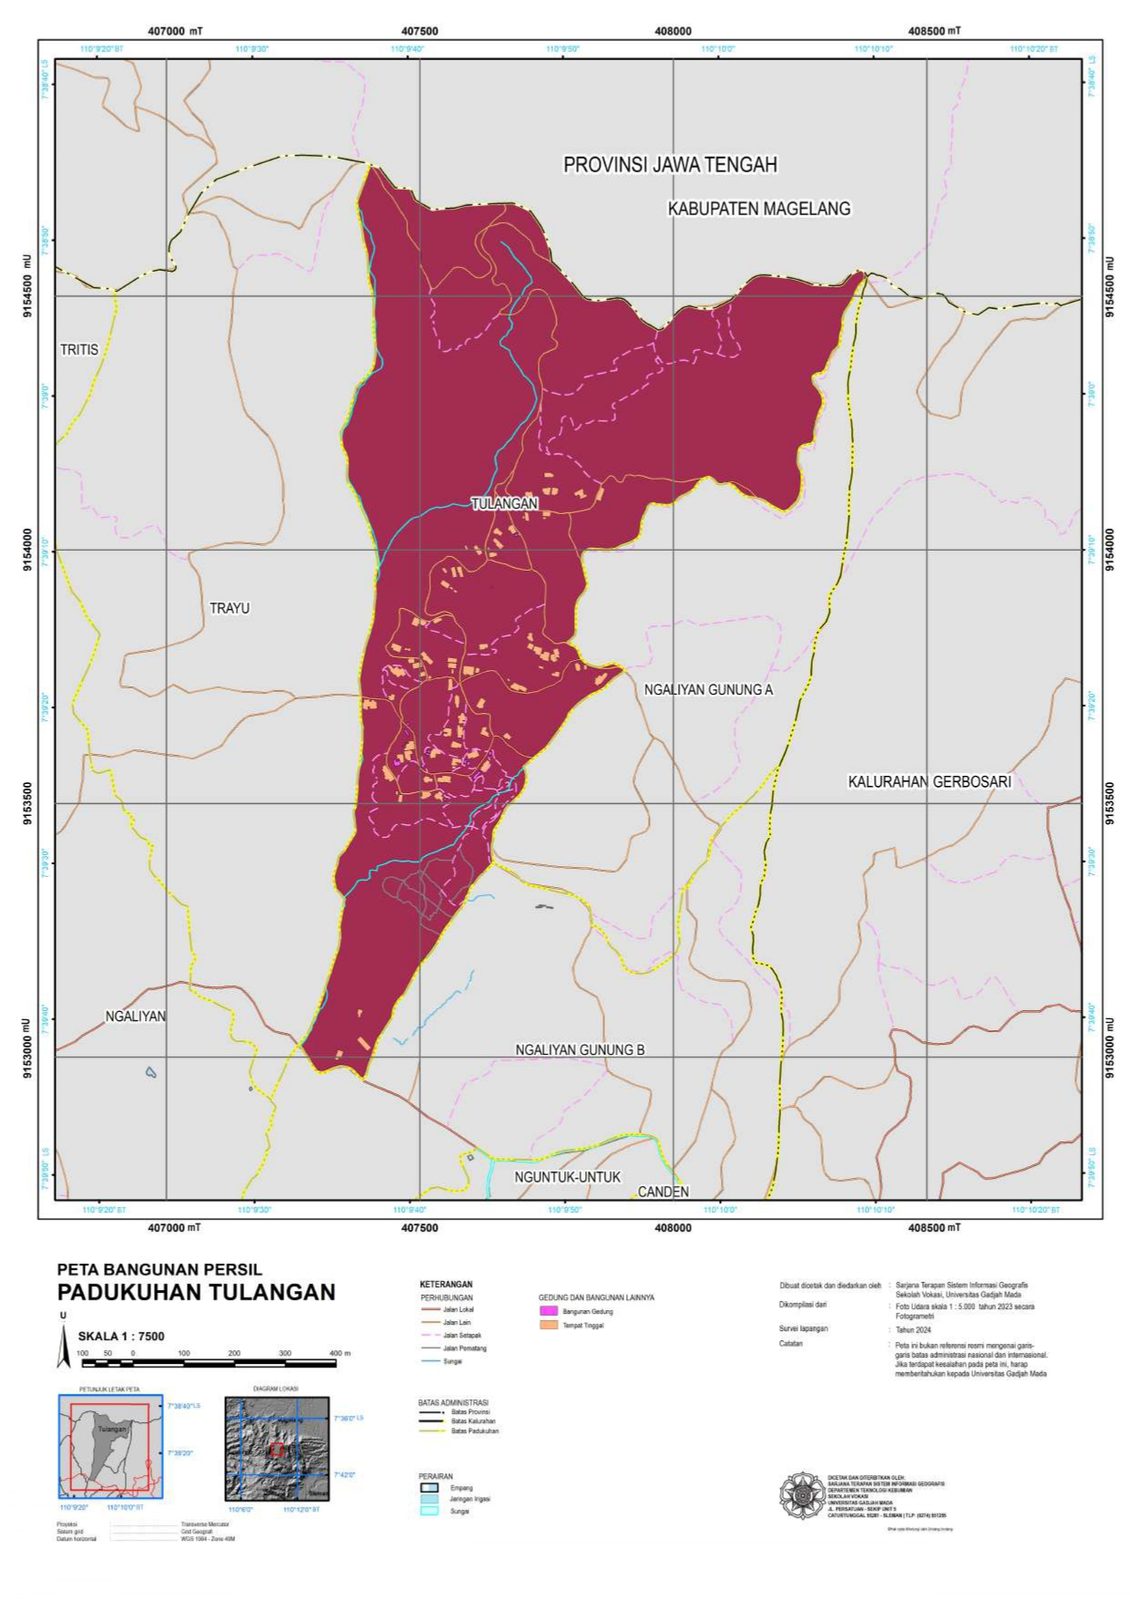
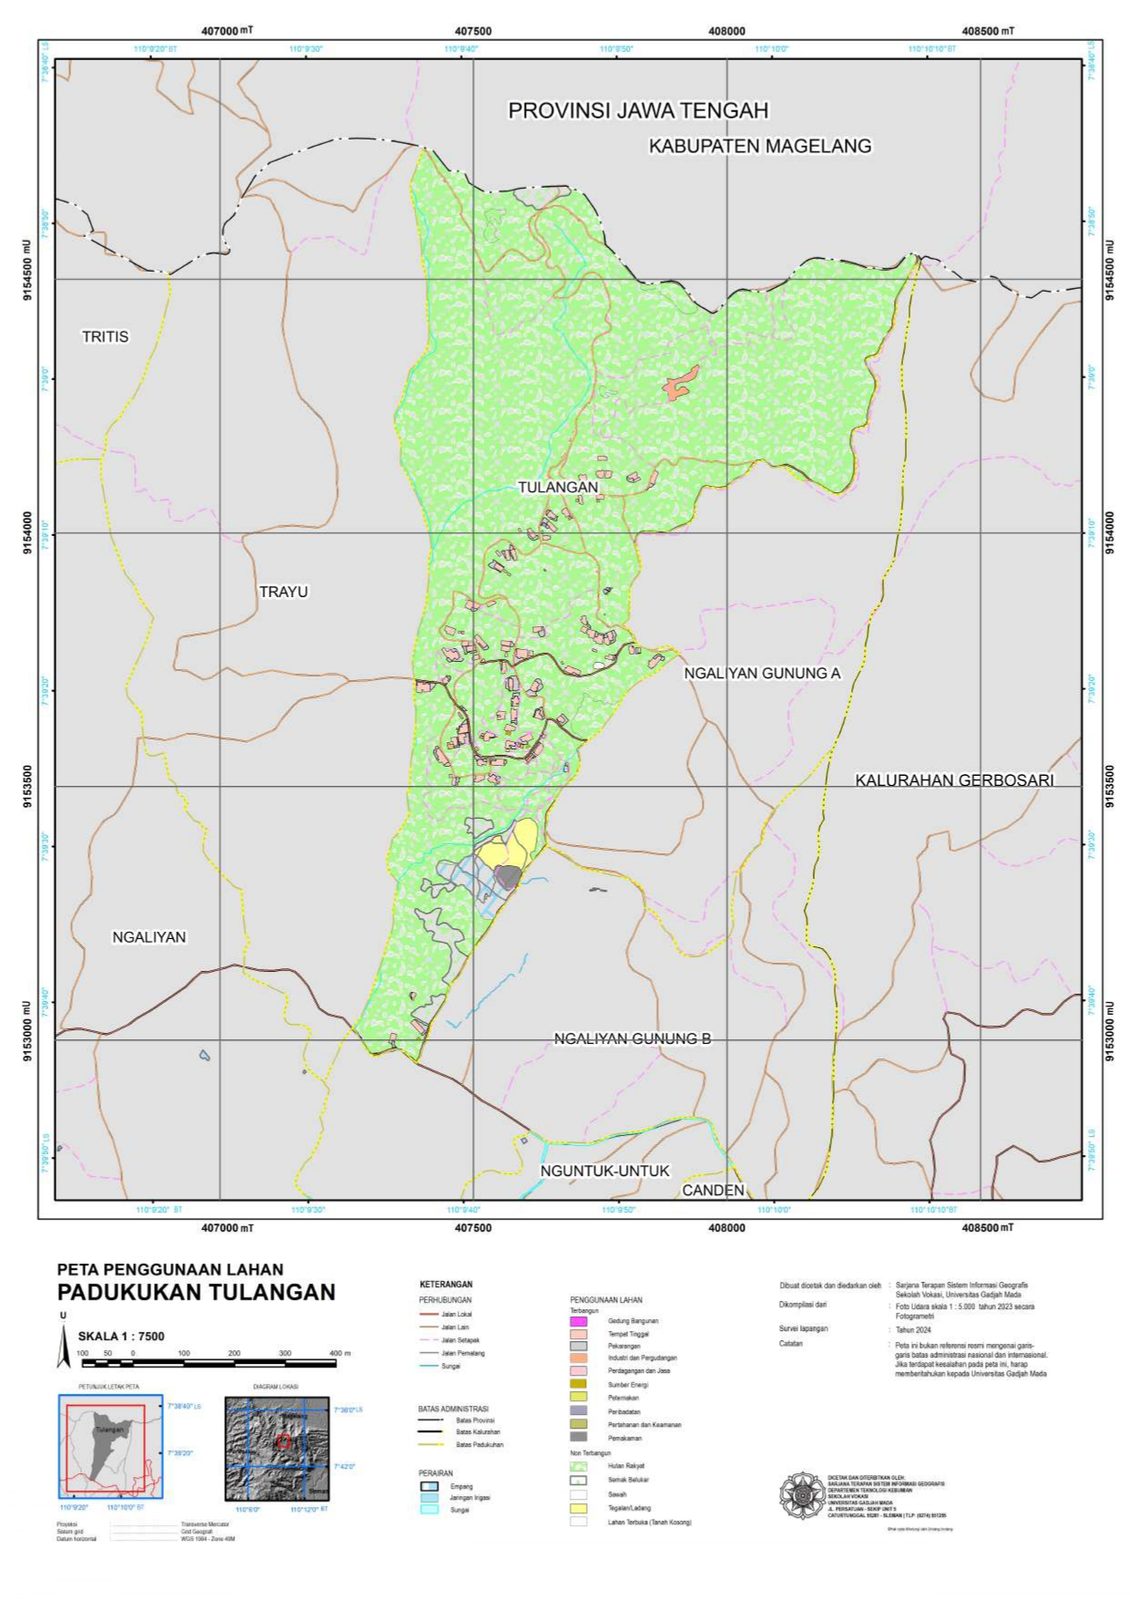
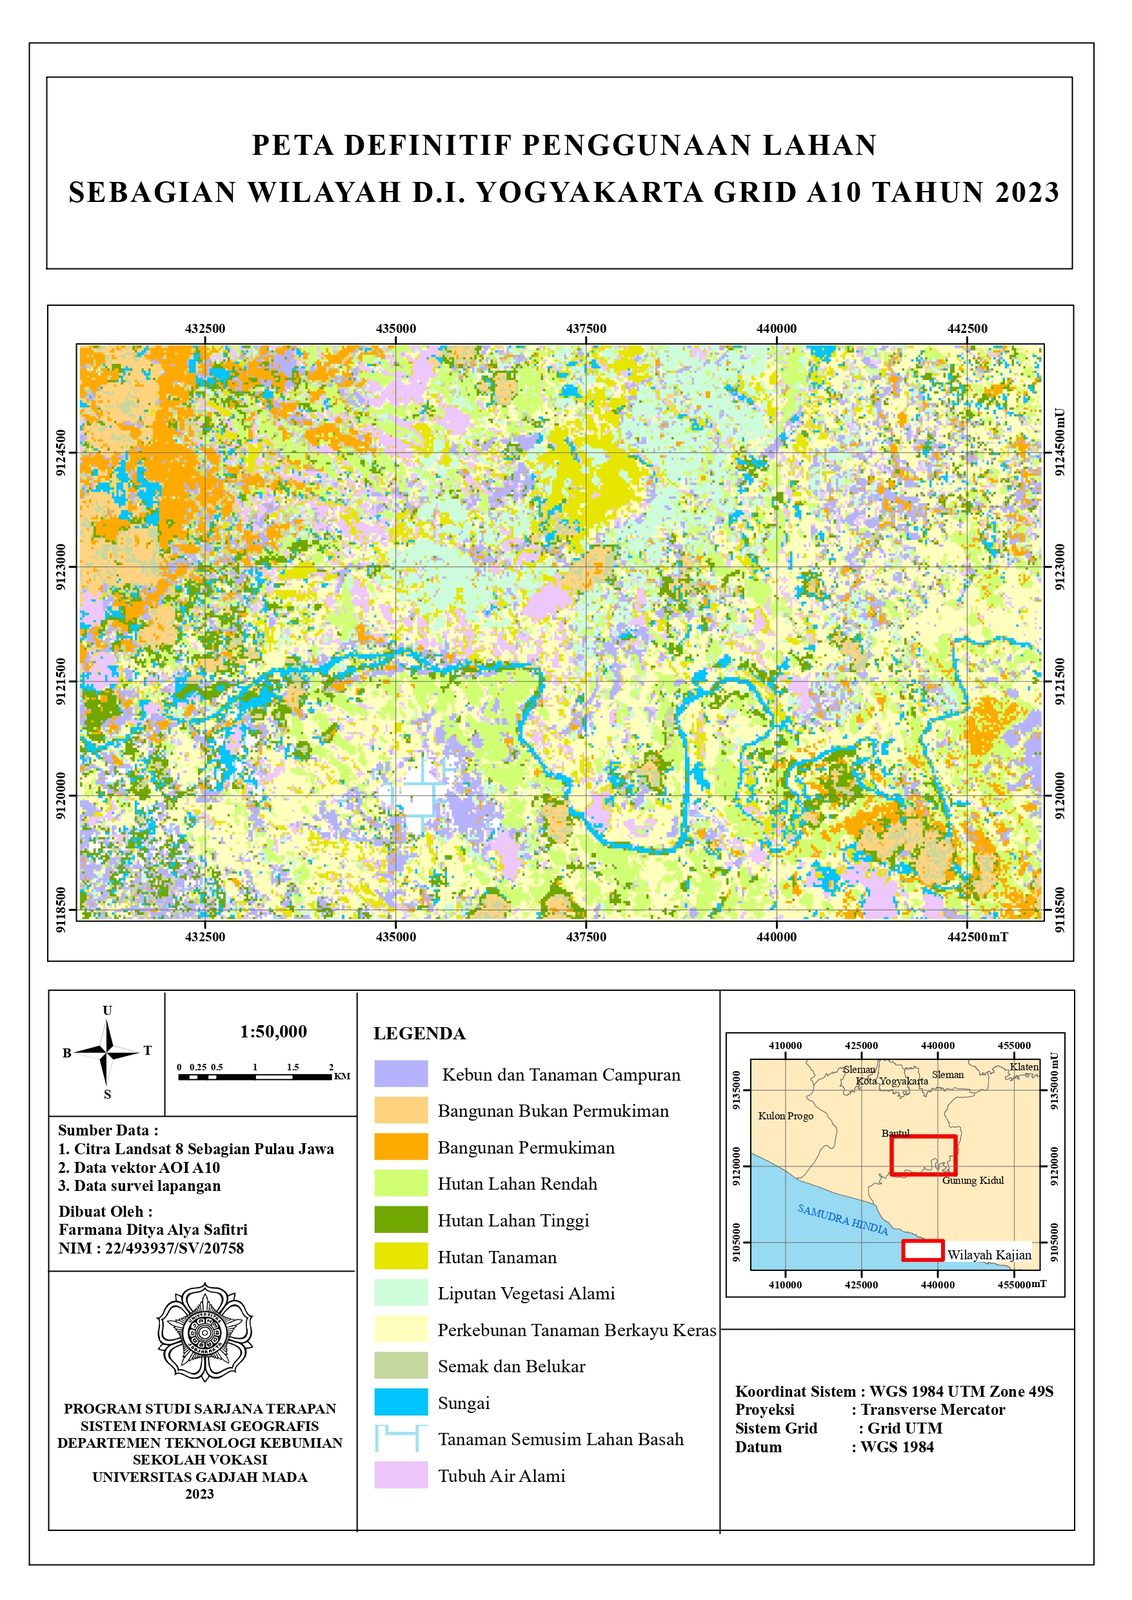
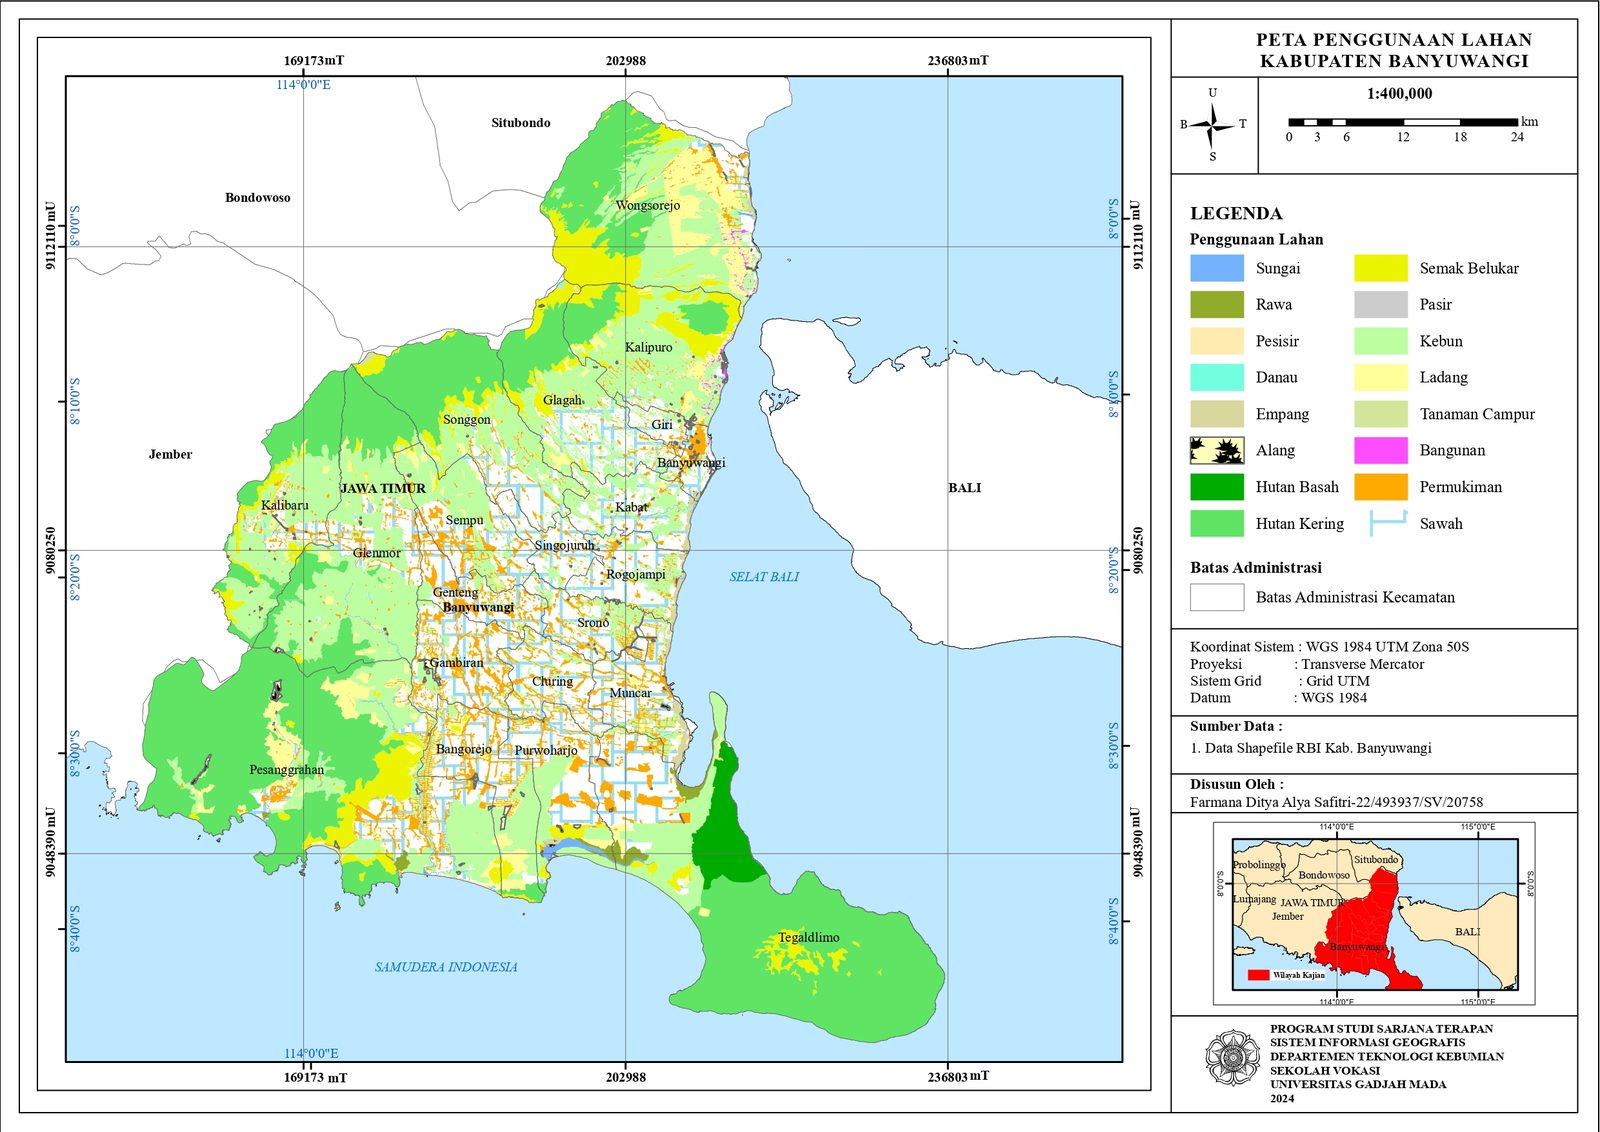
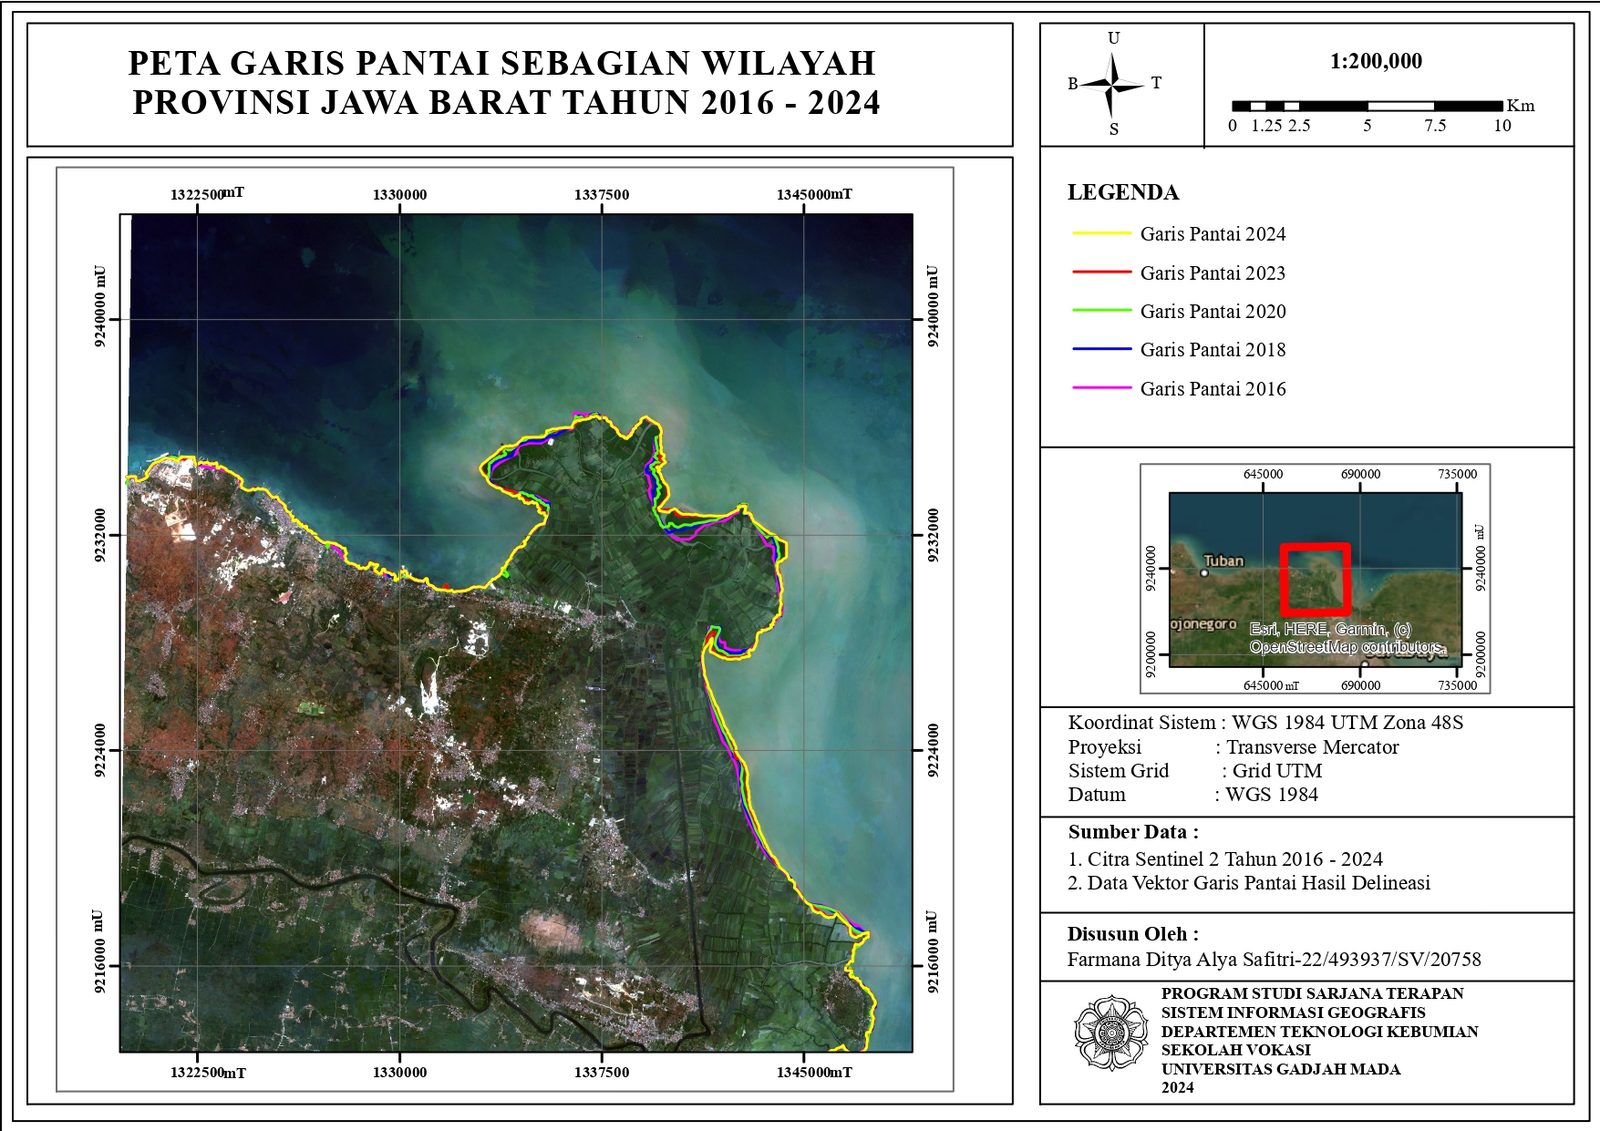
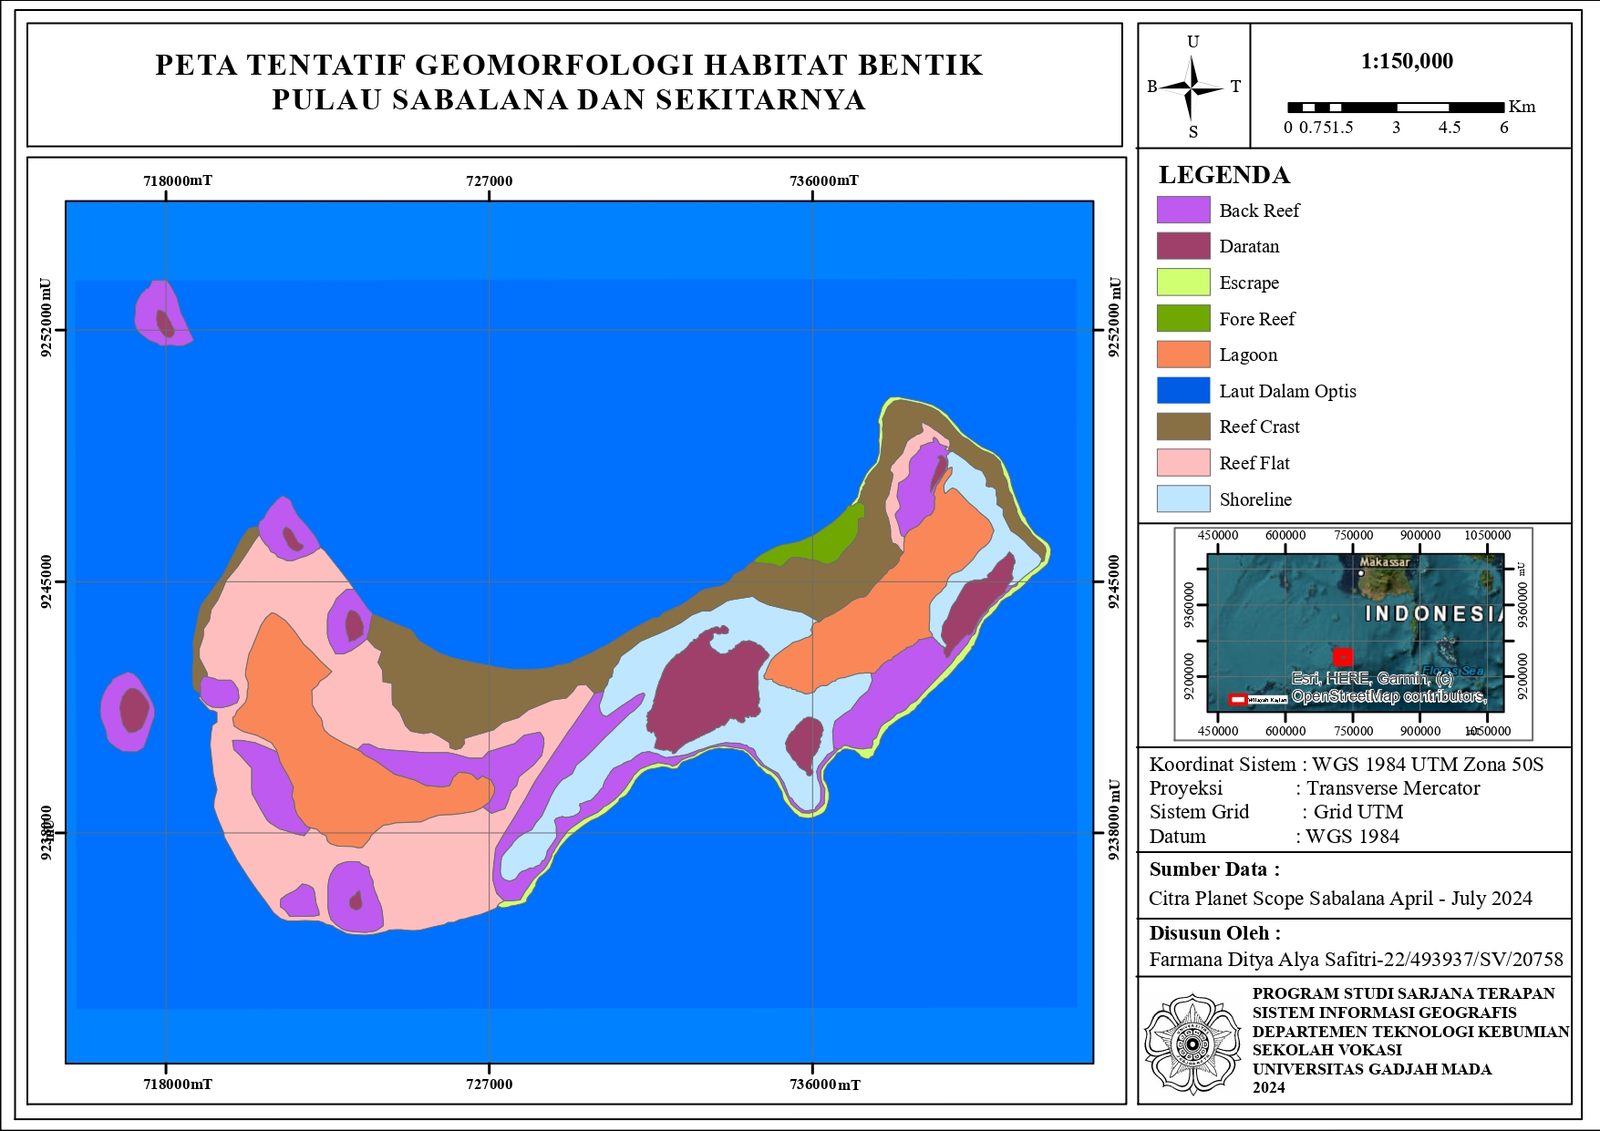
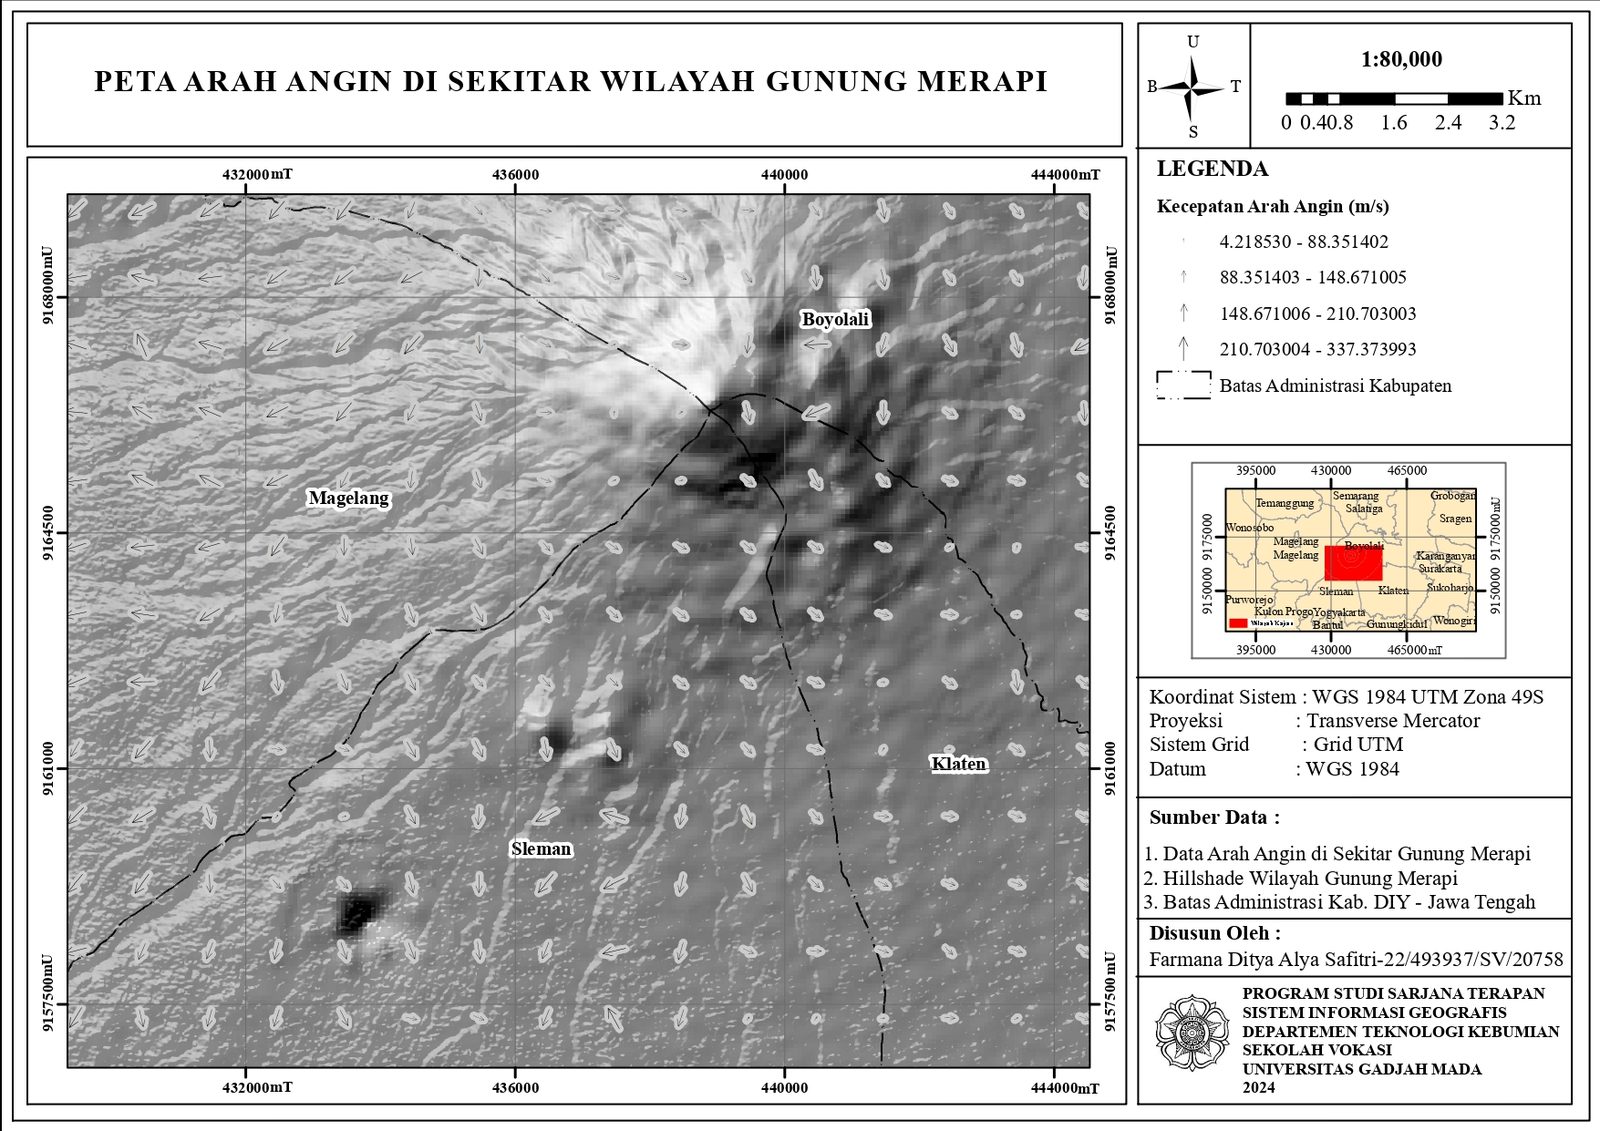
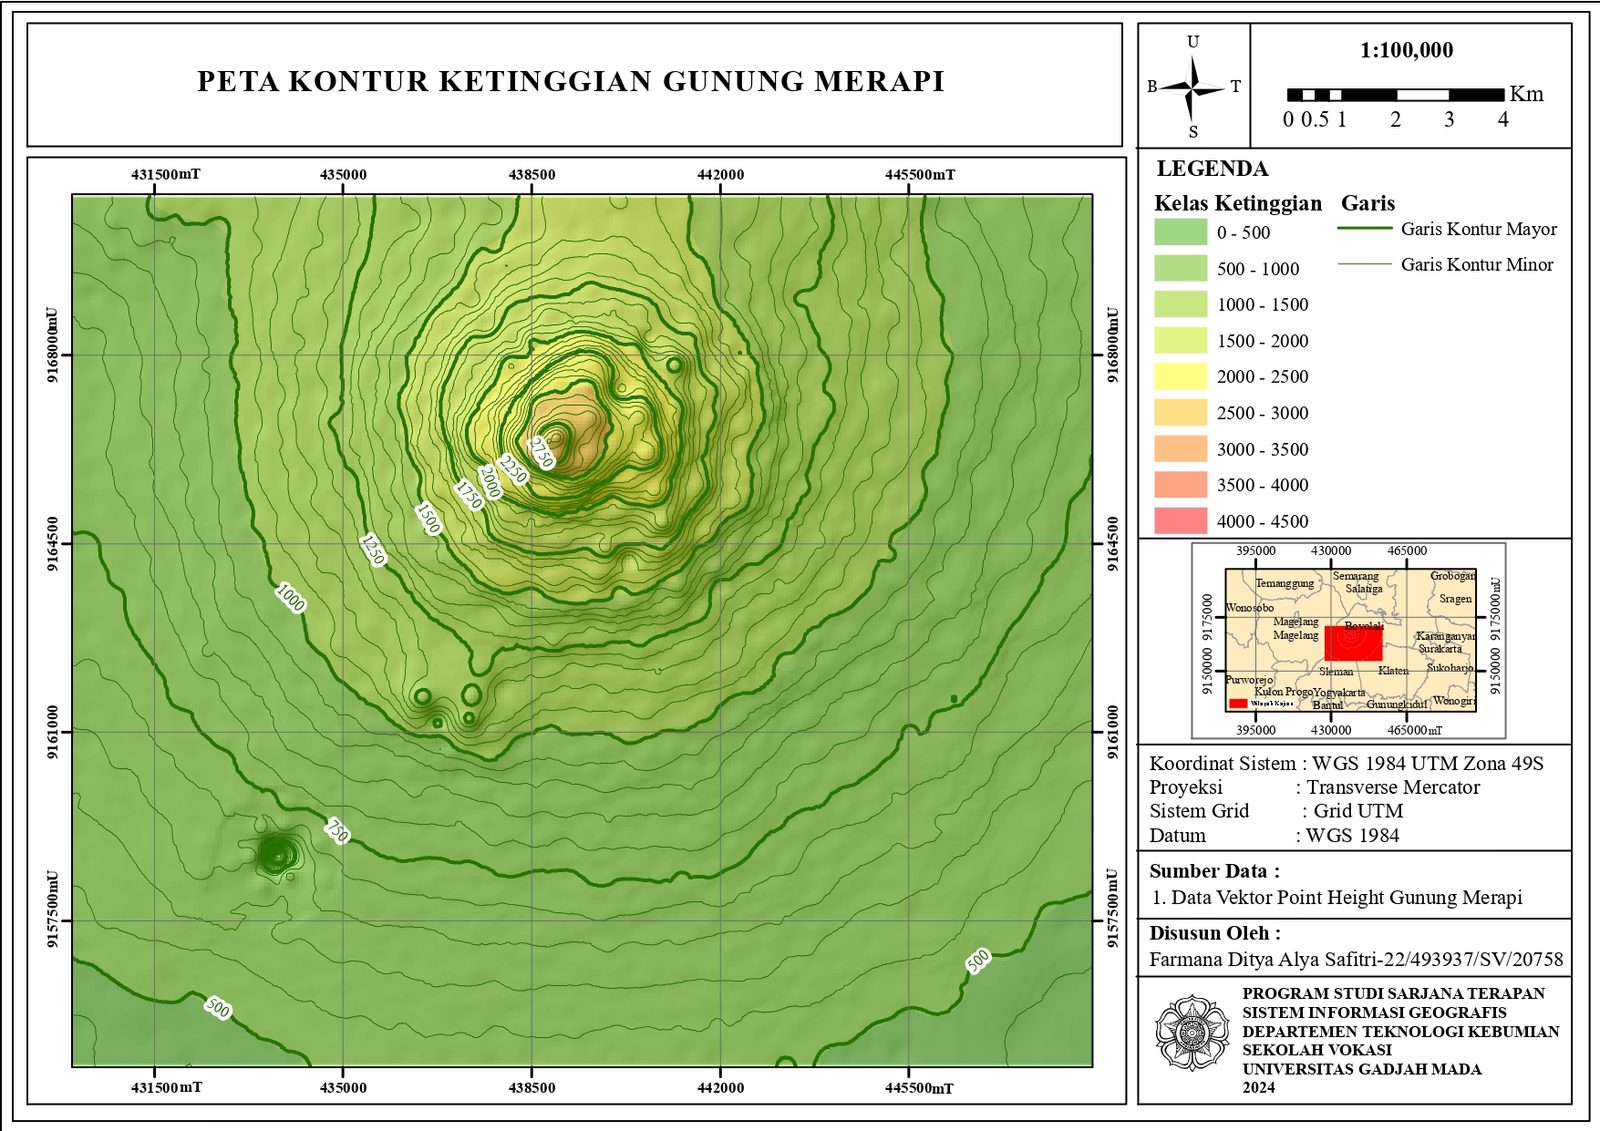
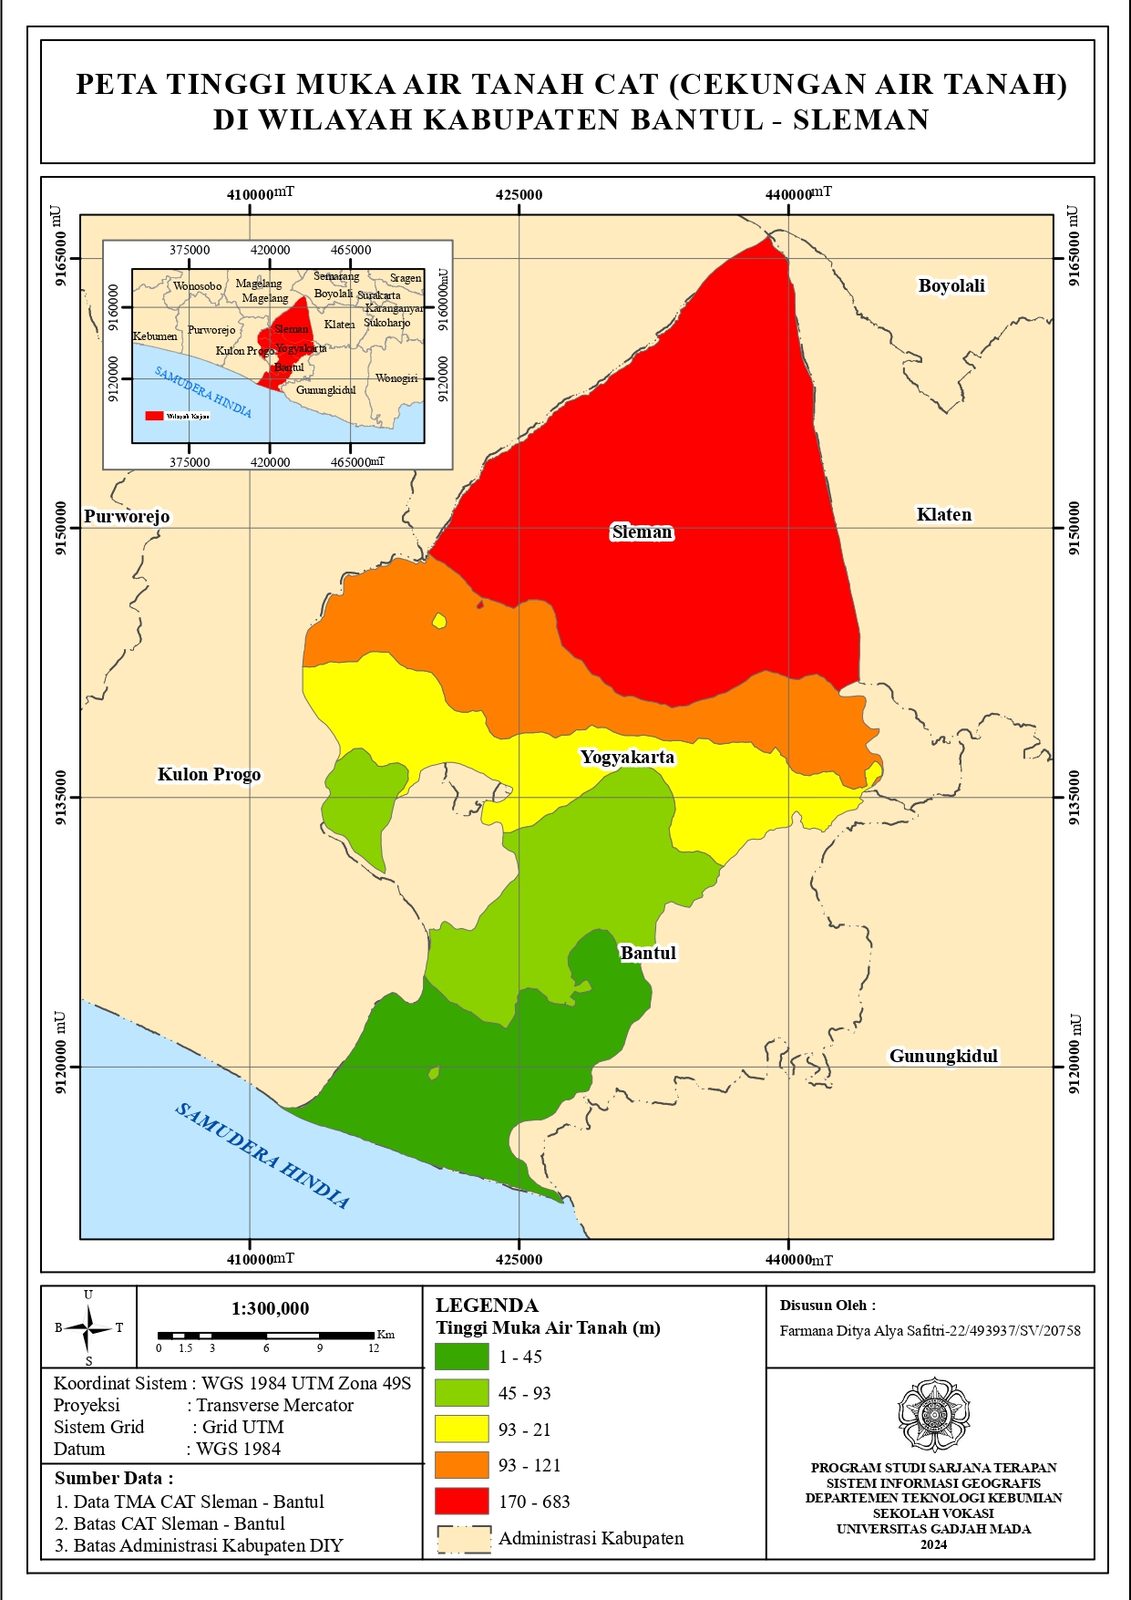
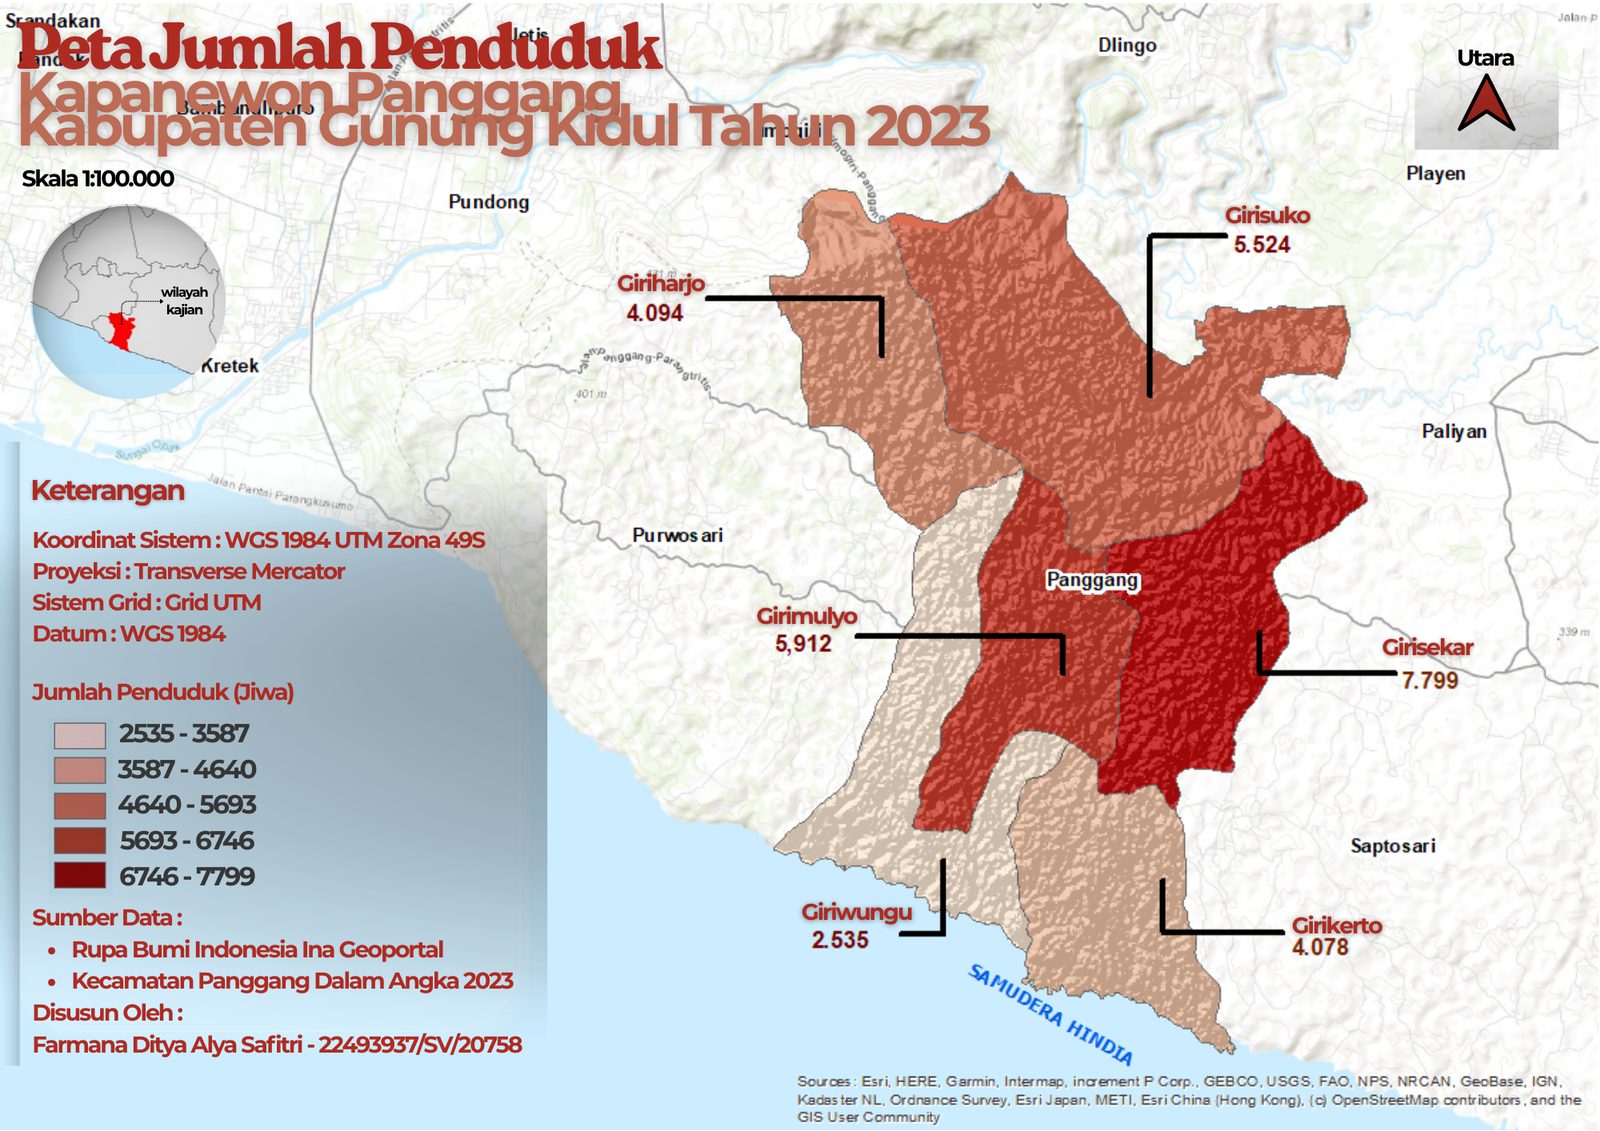
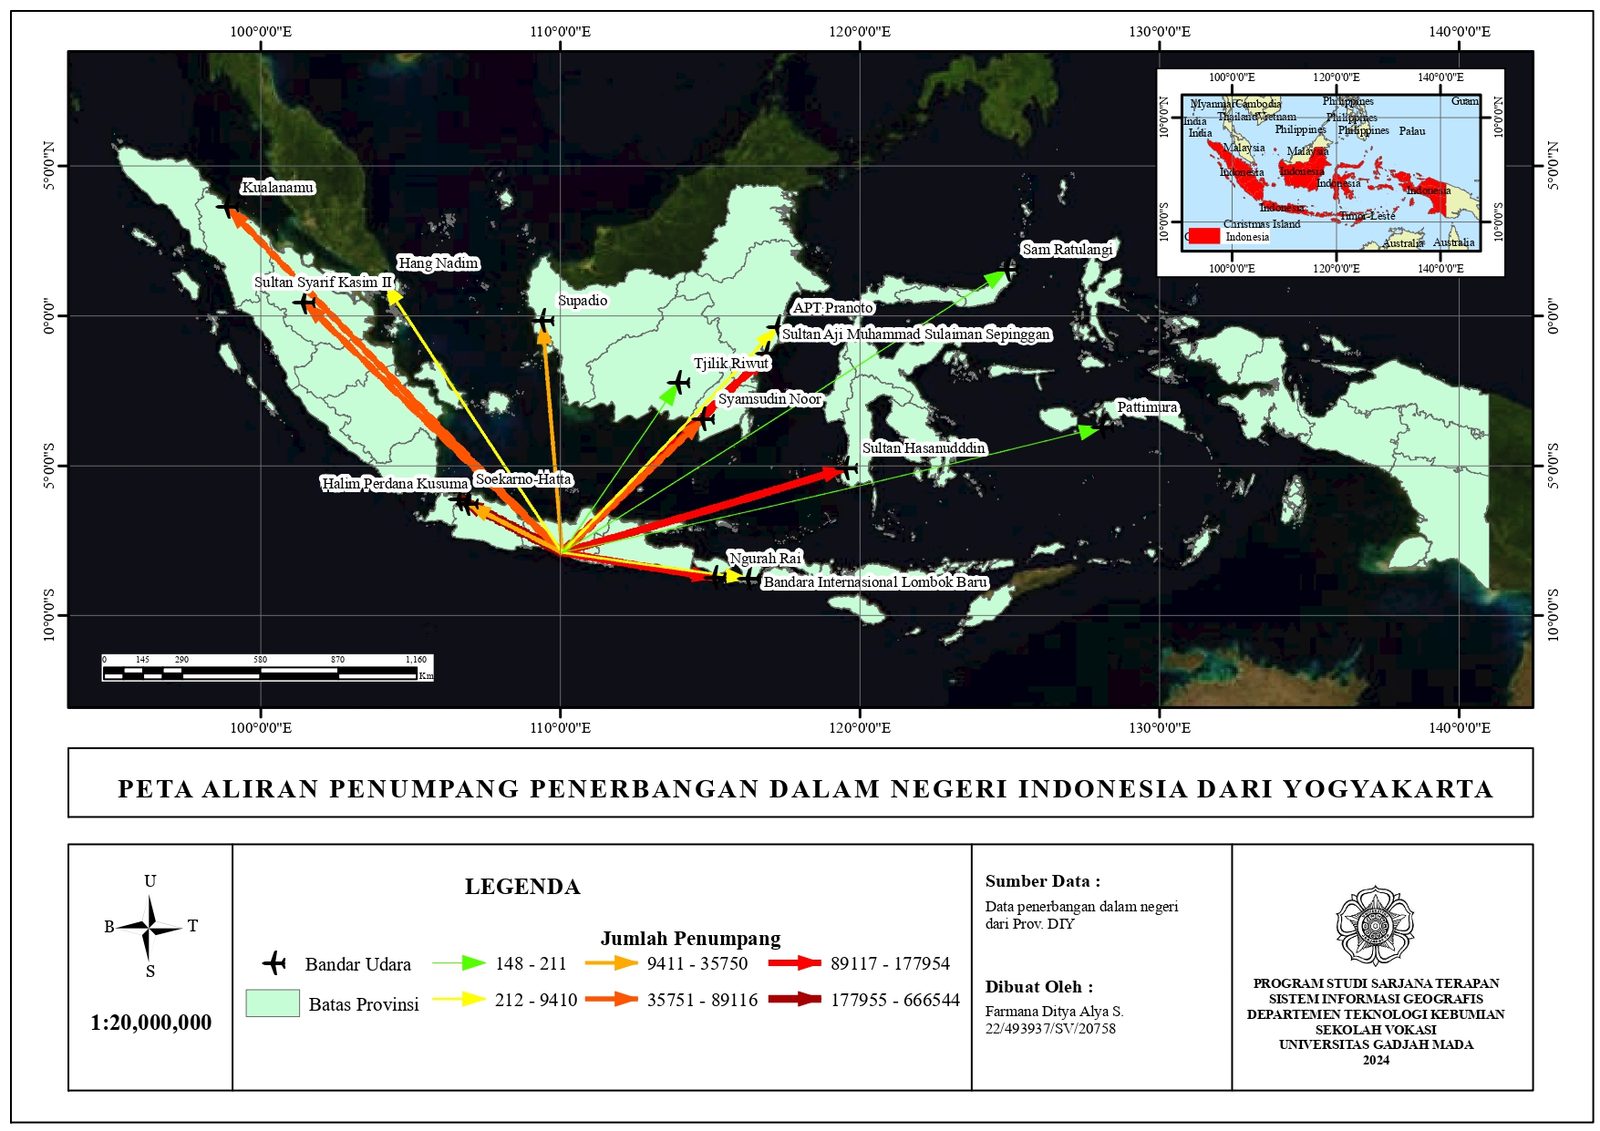
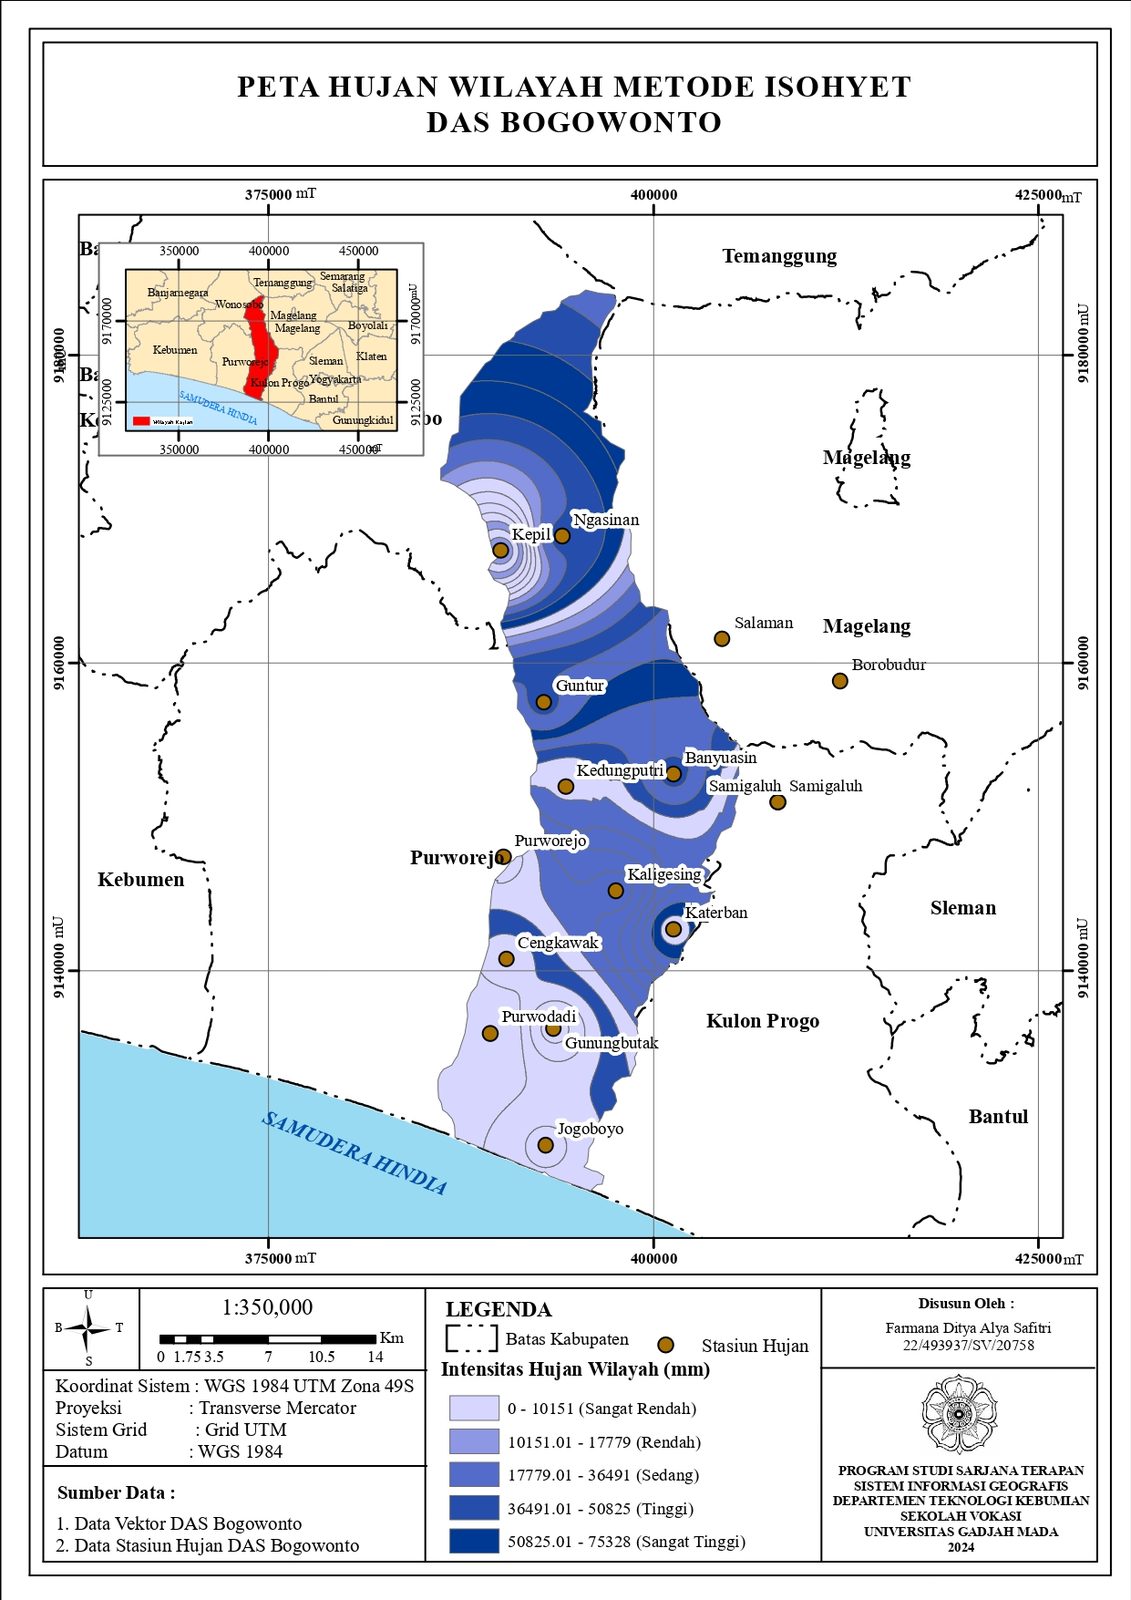
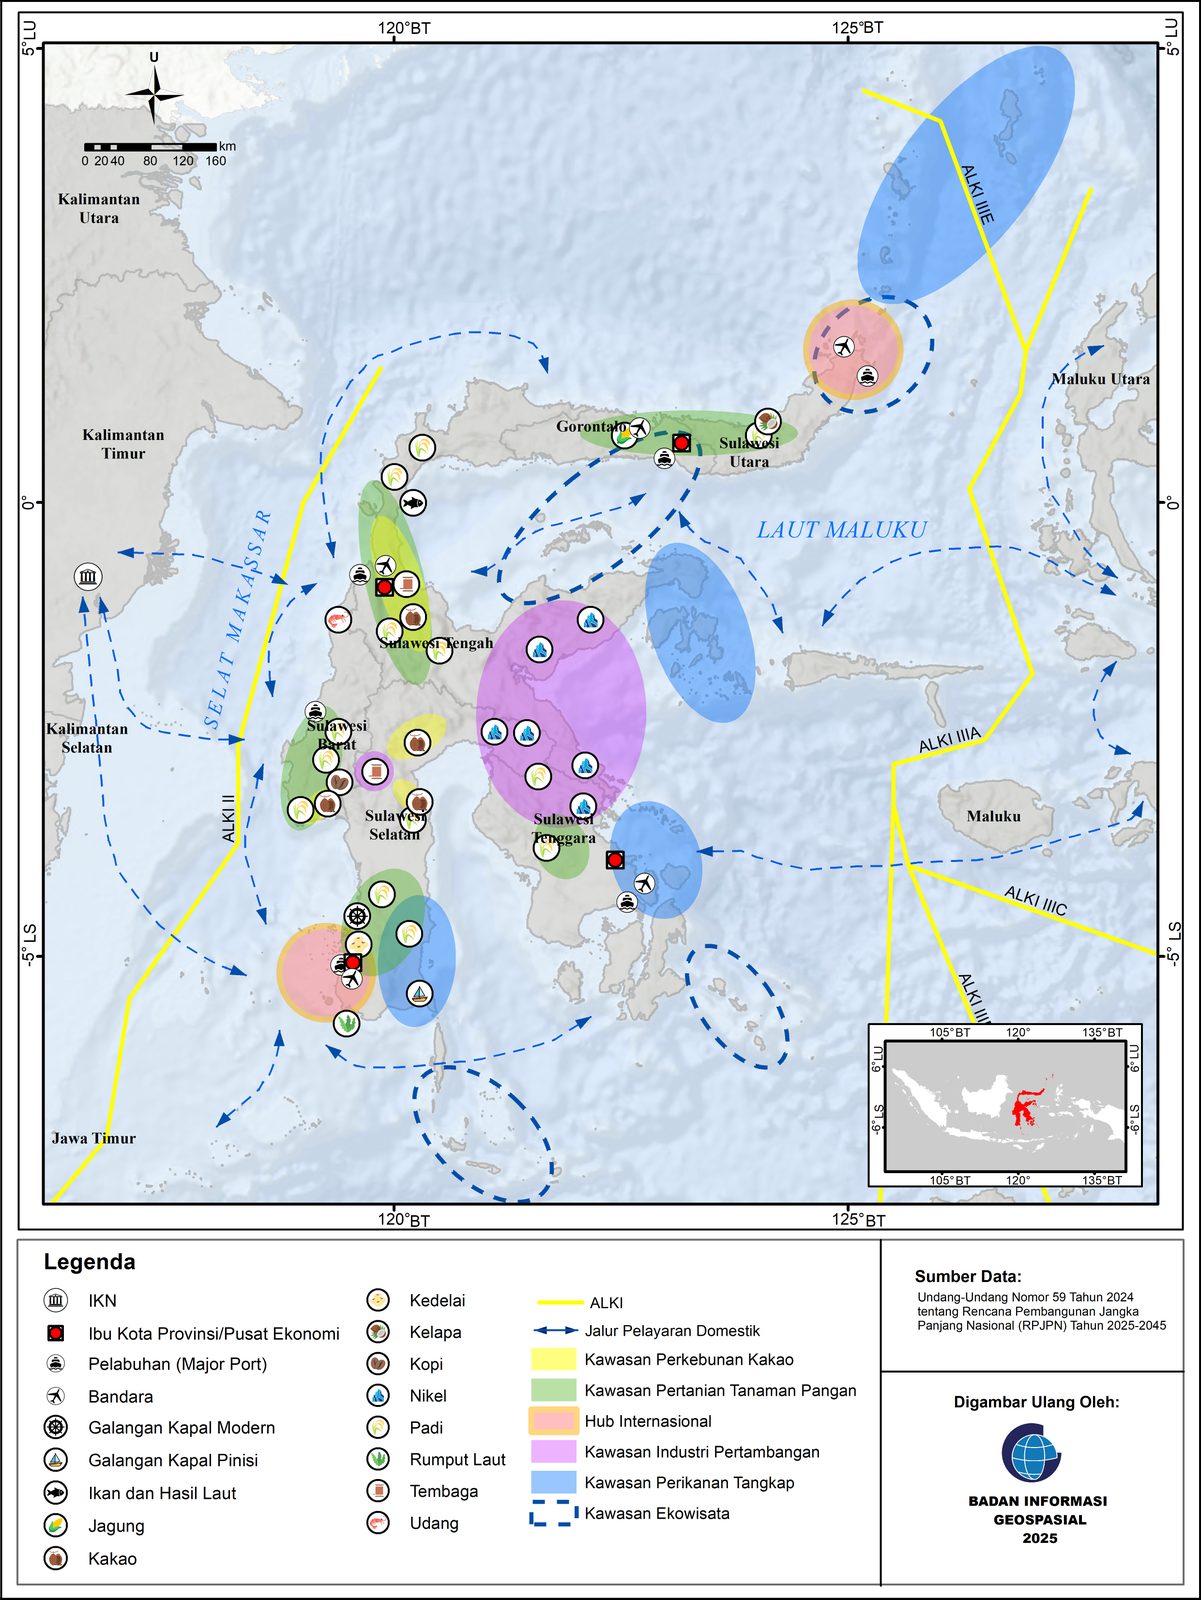
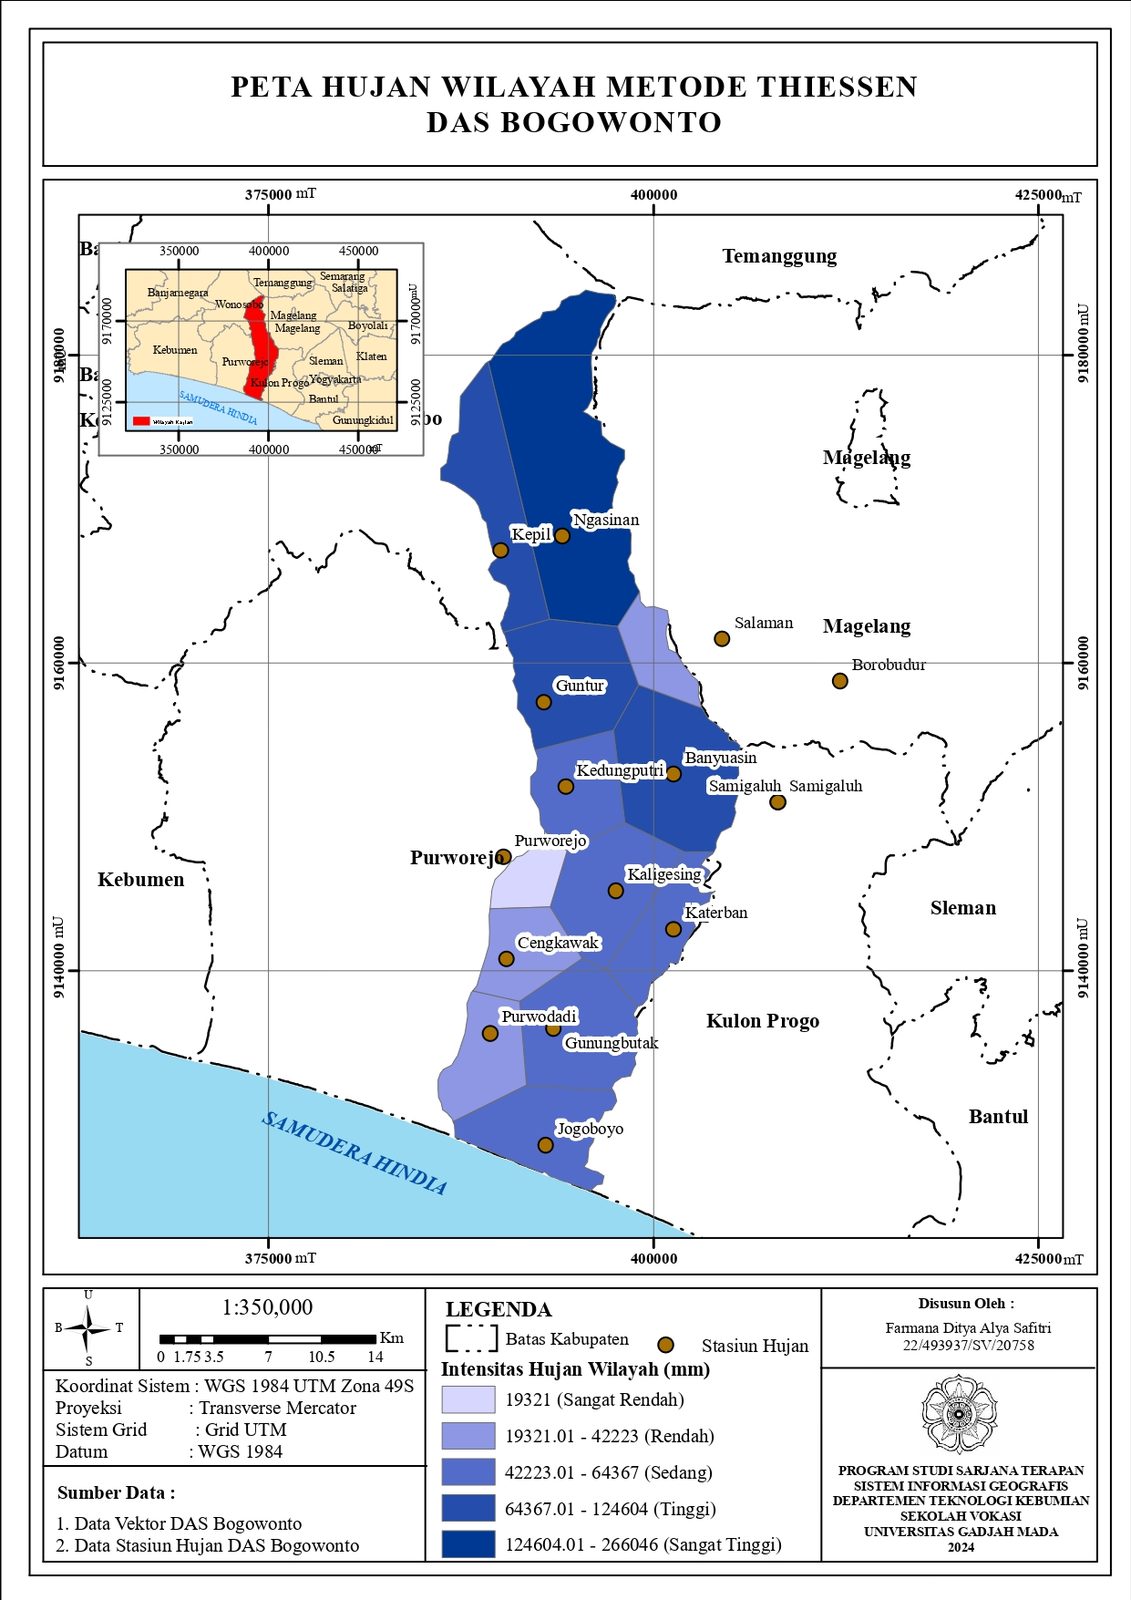
A curated set of thematic maps, from administrative atlases to land-use, geology, and environmental analysis.
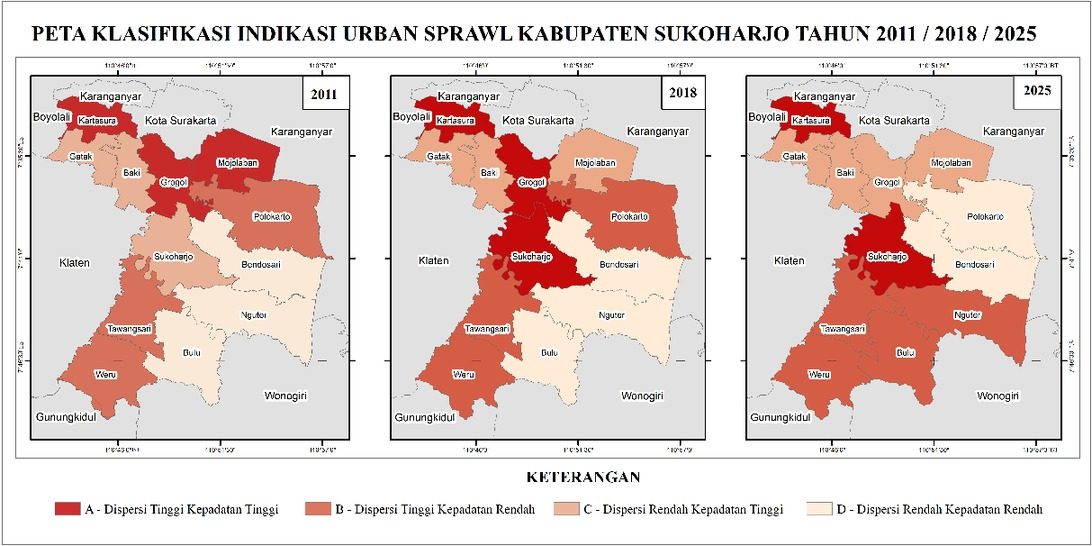
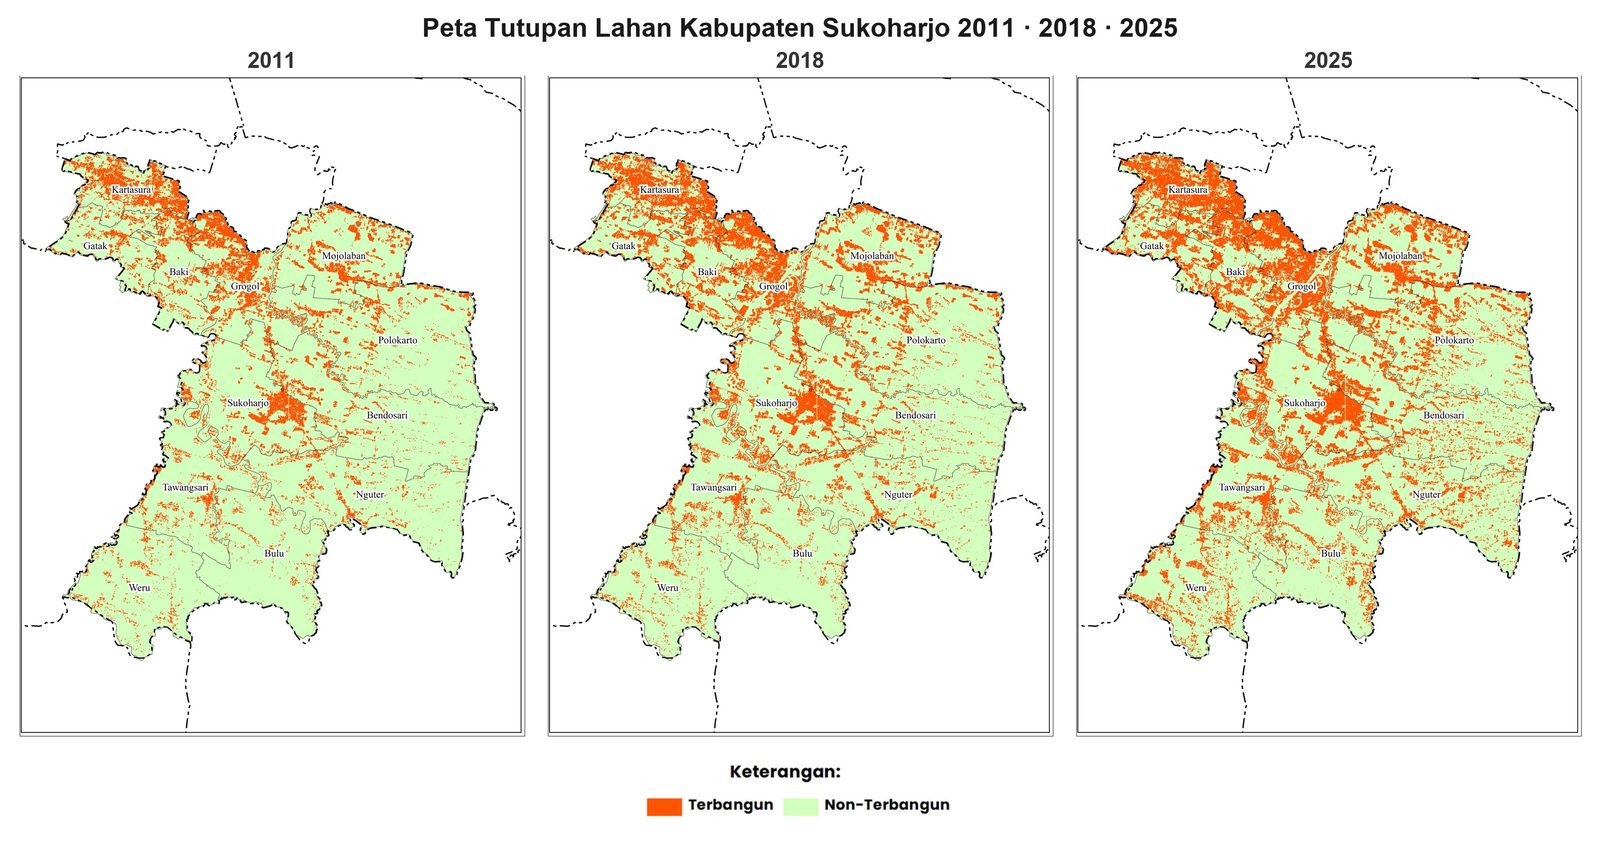
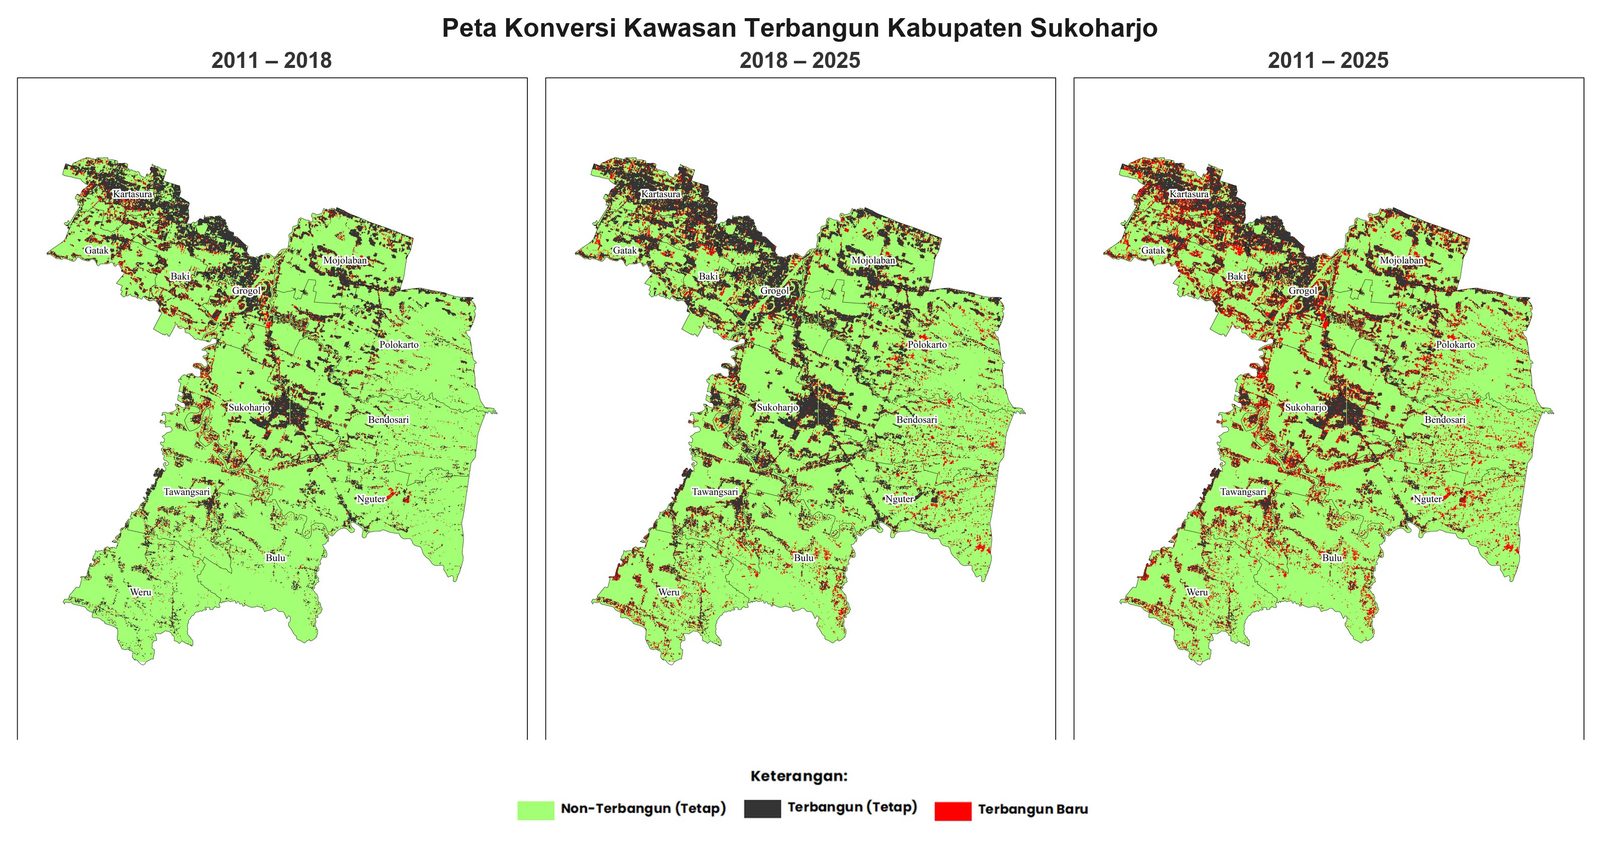
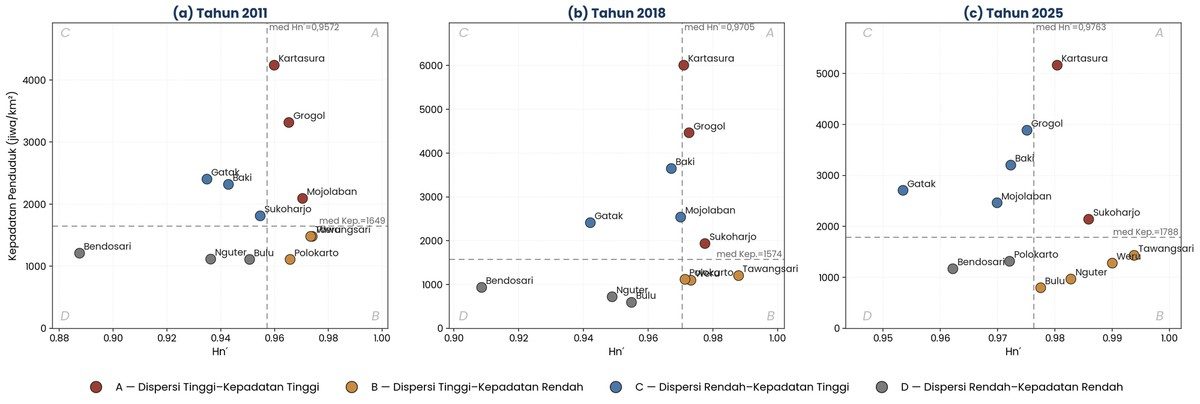
My undergraduate research detects and quantifies indications of urban sprawl across Kabupaten Sukoharjo using the Shannon entropy index, combining multi-temporal satellite imagery and built-up area analysis to measure how compact or dispersed the region's urban growth has become.
Open to collaborations on cartography, GIS analysis, web mapping, and remote sensing research. Pick the channel that fits.